Table of Contents
iZIP data preliminary plots
| Phonon spectrum, 2015 Sep 1 -4/+4 V |
|---|
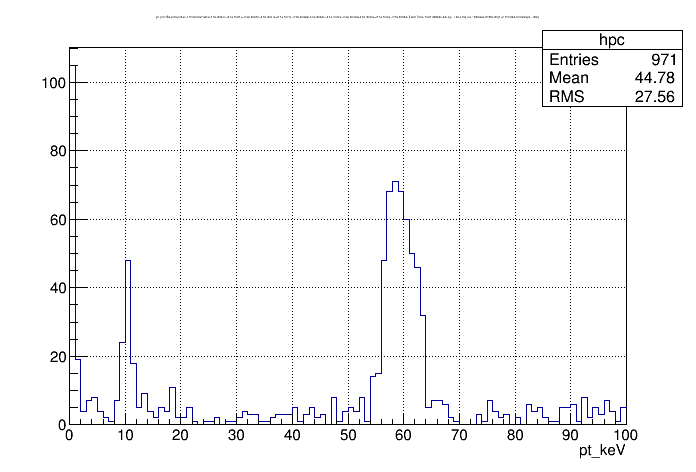 |
| cuts: charge symmetry, no randoms. No quality cuts. |
| phonon channels not balanced (no relative calibration). empirical ptotal calibration. |
| Phonon spectrum, 2015 Sep 1 -4/+4 V, phonon balancing to optimize 60 keV peak |
|---|
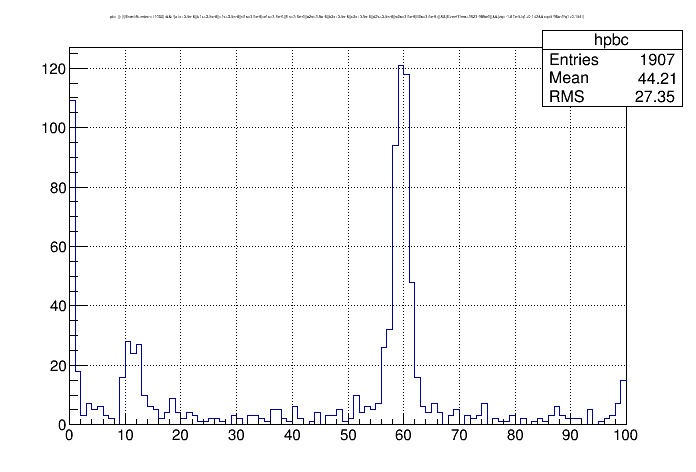 |
| as above but with an attempt at phonon channel balancing |
| channel balancing factors individually set to 0.5, 1.0, or 2.0 to minimize 60keV line width |
| Phonon spectrum, 2015 Sep 1 -4/+4 V, phonon balancing to optimize 10 keV peak |
|---|
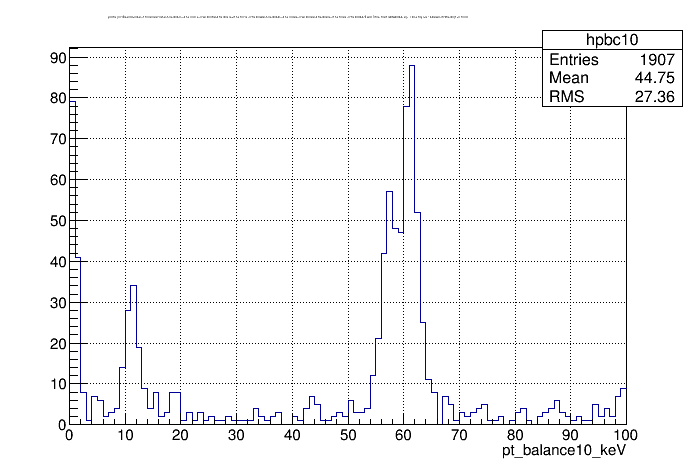 |
| as above but channel balancing factors set to minimize 10keV line width |
| Phonon spectrum, 2015 Sep 1 -4/+4 V, phonon balancing to optimize 10 keV peak |
|---|
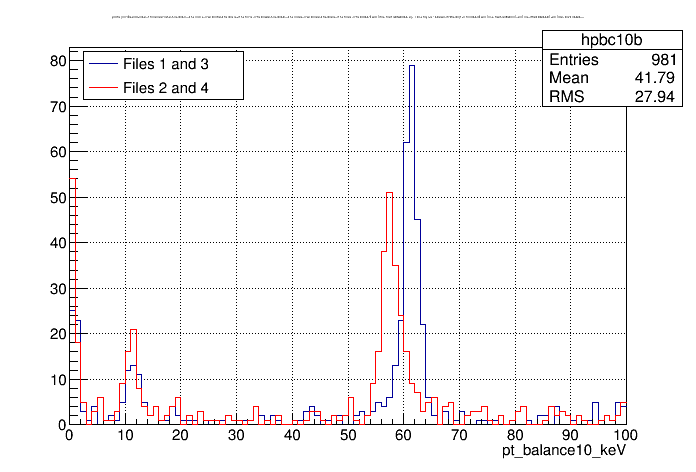 |
| same as above but split into two different time cuts |
| sigma/center = 13.2% at 10 keV, 2.4% at 60 keV |
| Phonon channel partitions in 60keV region, 2015 Sep 1 -4/+4 V | |
|---|---|
| Side 1 pA | Side 1 pB |
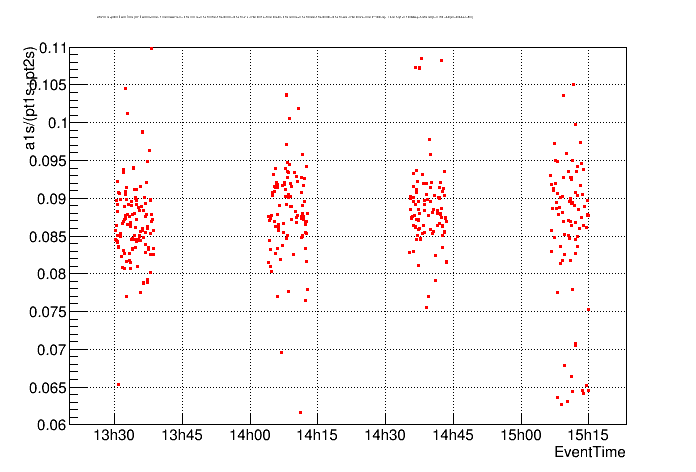 | 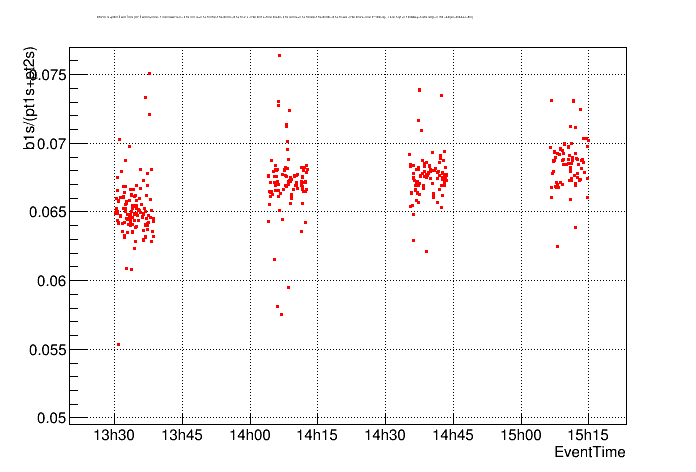 |
| Side 1 pE | Side 2 pB |
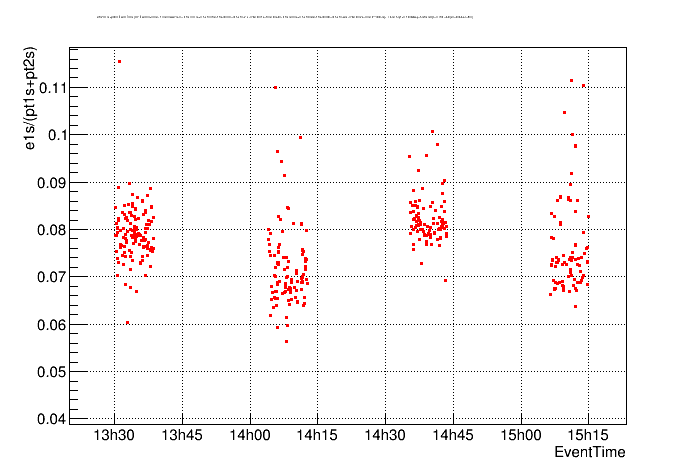 | 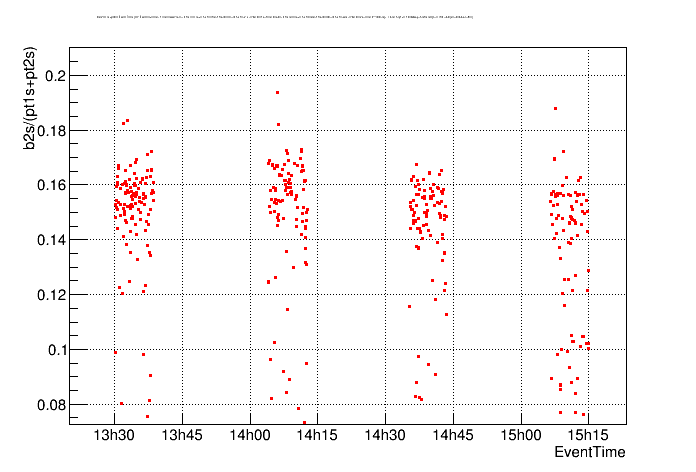 |
| Note that the 60keV optimized balancing suppressed Side 1 pE (lower left) by a factor of 4 relative to the 10keV optimization. | |
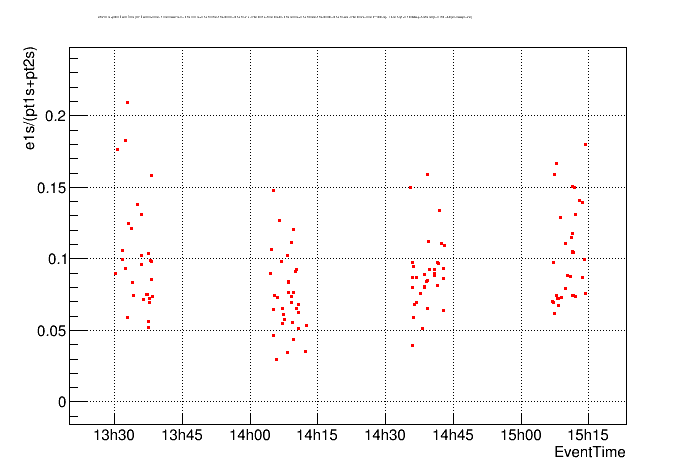
| Phonon channel partitions in 10keV region, 2015 Sep 1 -4/+4 V |
|---|
| Side 1 pE |
 |
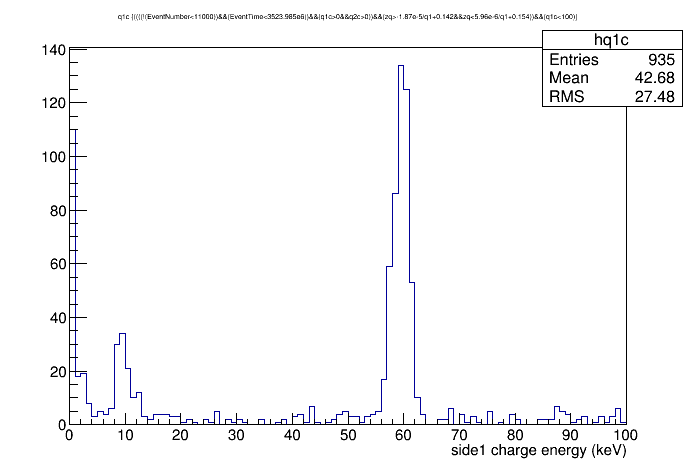
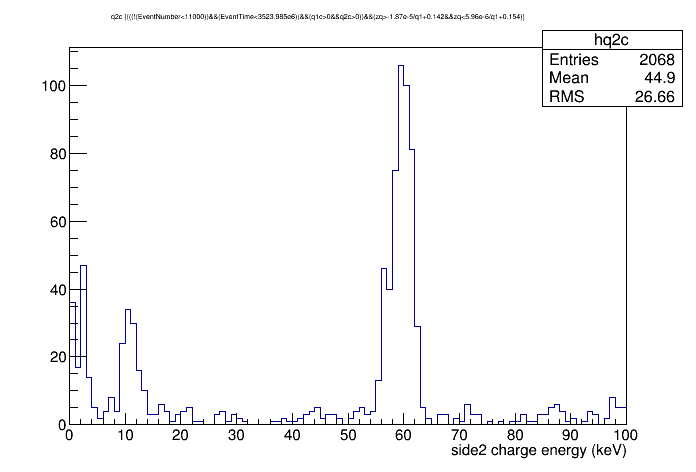
| Charge spectrum, 2015 Sep 1 -4/+4 V | |
|---|---|
 |  |
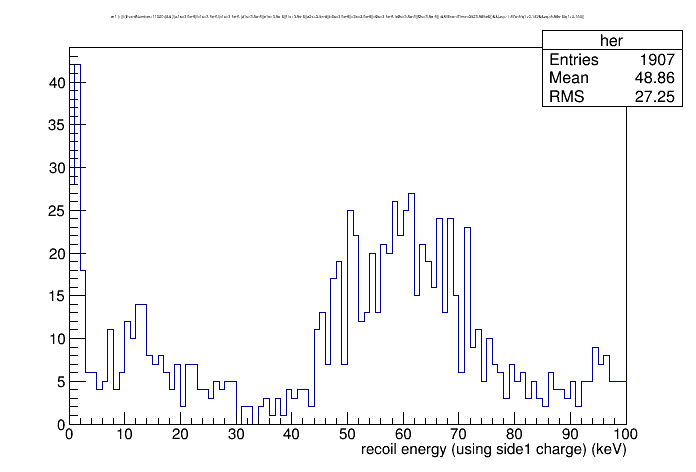
| Recoil spectrum, 2015 Sep 1 -4/+4 V |
|---|
 |
| Recoil spectrum, 2015 Sep 1 -4/+4 V |
|---|
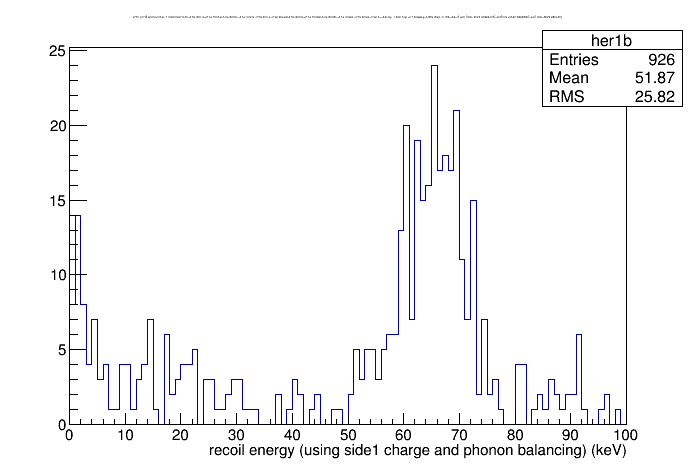 |
| using phonon balancing optimized for 10keV, Files 1 and 3 only |
| sigma/mean at 60keV = 8.8% |
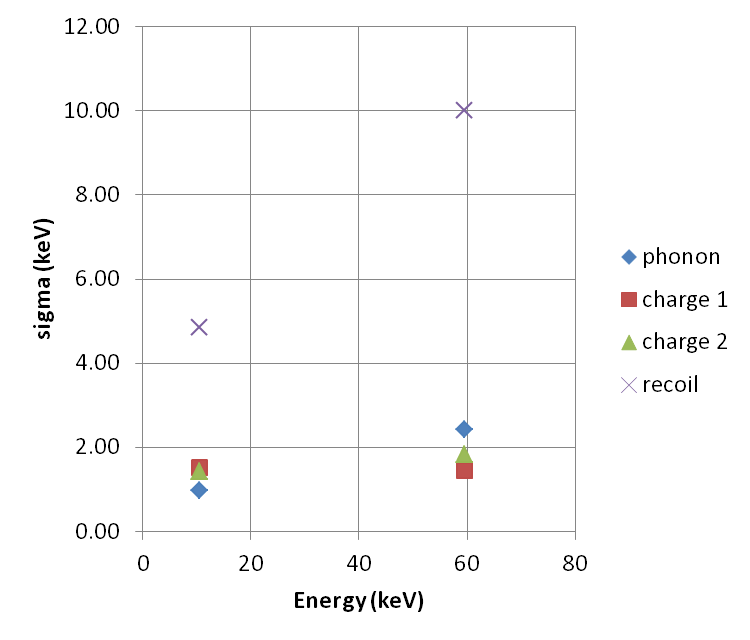
| Energy resolution, 2015 Sep 1 -4/+4 V |
|---|
 |
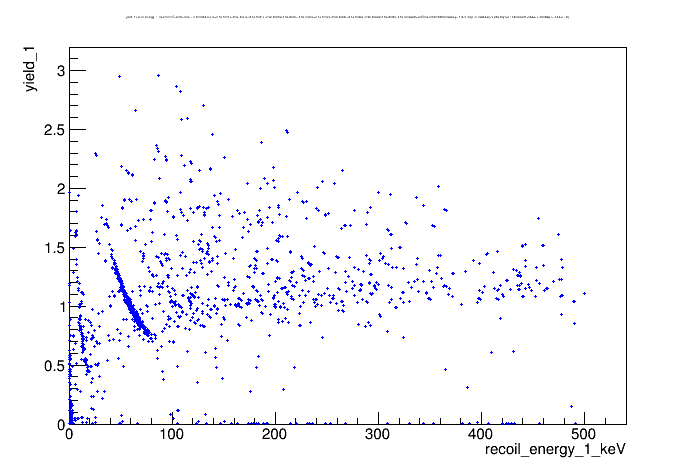
| Yield versus recoil energy, 2015 Sep 1 -4/+4 V |
|---|
 |
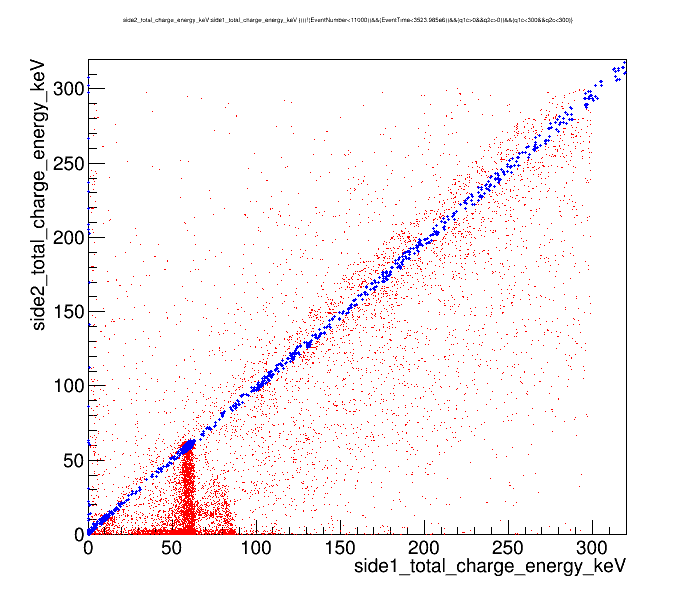
| Side2 charge versus Side1 charge. Blue points pass charge symmetry cut |
|---|
 |
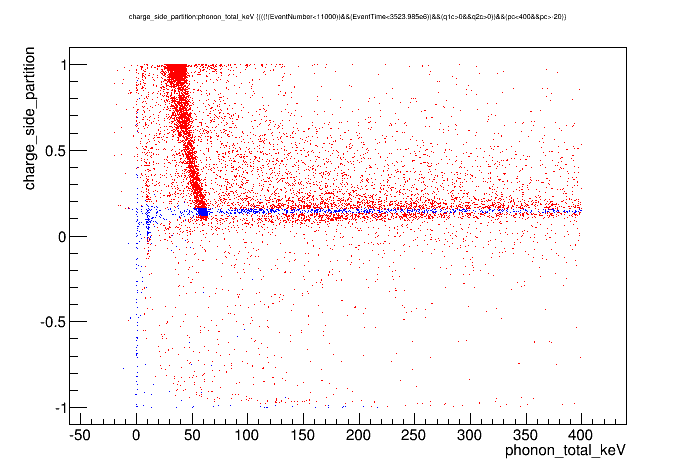
| Phonon energy versus charge side partition. Blue points pass charge symmetry cut |
|---|
 |
Nuclear recoil yield band
| Yield versus recoil energy for Cf data taken Sep 29-30, -4V/+4V |
|---|
| no chisquare or qinner cuts |
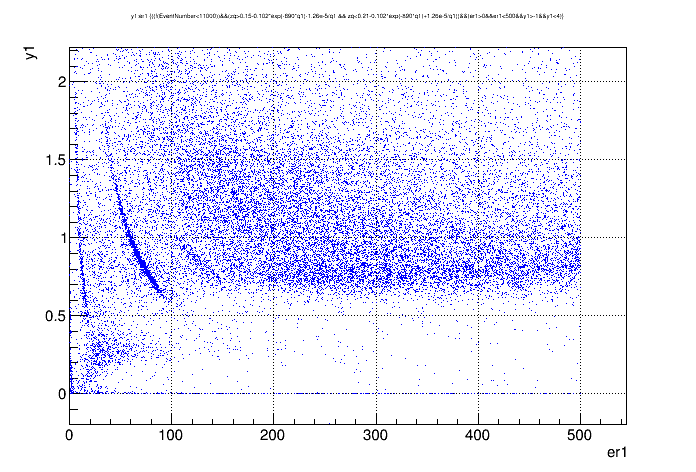 |
| based on non-balanced summed phonon amplitudes and summed Side 1 charge amplitudes |
| cuts applied: charge symmetry, no randoms |
| 20 series = 5 hours of data = 15 hours of data-taking |
| neutron count: 738 events between 10 and 100 keV with 0.1 < yield < 0.4 |
| Cf series taken as of Oct 7: 82 @ -4/+4V, 12 @ -2V/+2V V |
| Yield versus recoil energy for Cf data taken Sep 29-30, -4V/+4V |
|---|
| with chisquare and tight qinner cuts |
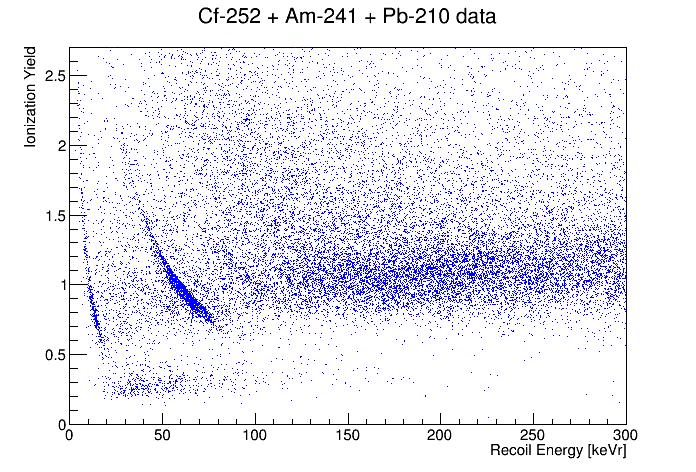 |
| From 20 series of Cf data taken Sep 29-30 (5 hours of data, 15 hours of running) |
| Charge energy based on mean of Side 1 and Side 2 Qinner, separately calibrated at 60keV |
| Phonon energy based on unbalanced Psum, calibrated at 60 keV |
| Cuts: randoms removed, charge symmetry, Q-inner both sides, Q-chisq both inner channels |
| 5-20 keV: 16 neutrons; 20-100 keV: 545 neutrons |
| Yield versus recoil energy for Cf data taken Sep 29-30, -4V/+4V |
|---|
| with chisquare and loose qinner cuts |
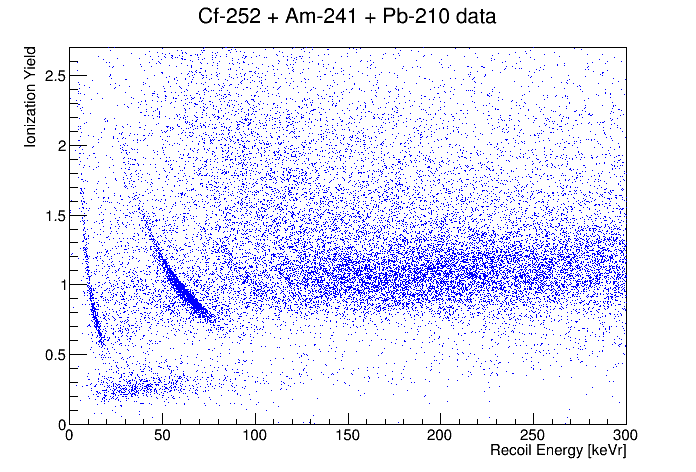 |
| As above but qinner cuts loosened to accept more low-energy events |
| Seems to improve low-energy neutron statistics 5×, without obvious leakage from ER band |
| 5-20 keV: 75 neutrons; 20-100 keV: 663 neutrons |
| Neutron recoil energy distribution for Cf data taken Sep 29-30, -4V/+4V |
|---|
| with chisquare and loose qinner cuts |
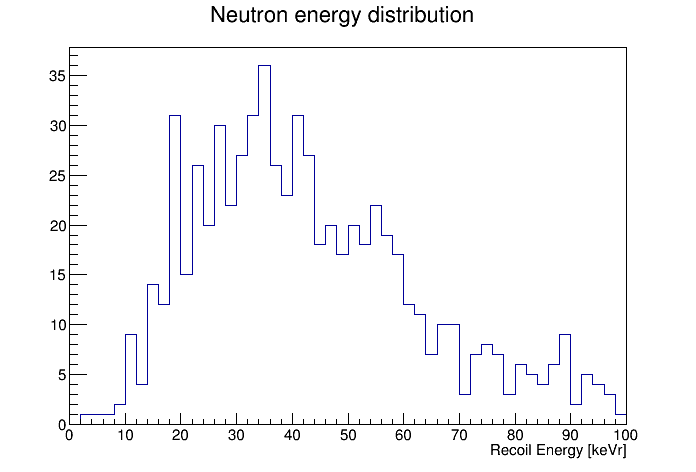 |
| Same cuts as above with a rough NR-band selection (0.1 < yield < 0.35) |
Note: above data was taken with all phonon thresholds set to 65 ADC units. Cf data taken since then has been at lower thresholds.
Background data
| Yield versus recoil energy for background data taken Sep 30-Oct 1, -4V/+4V |
|---|
| (note: Oct 2-3 data unusable because DIB1pB was dead throughout |
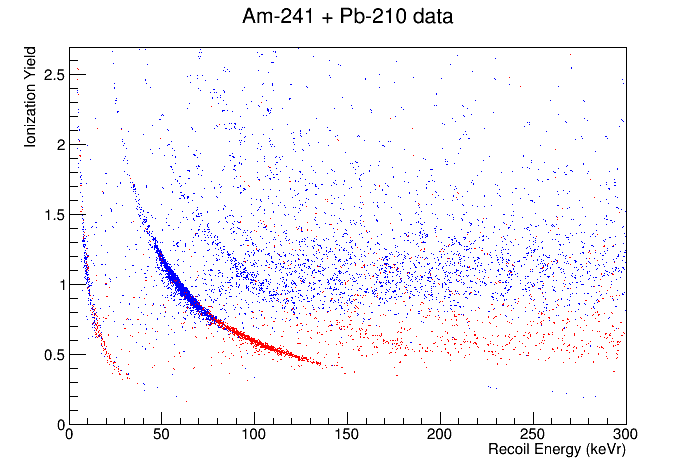 |
| 20 series (5 hours of data, 15 hours of running) |
| Charge energy based on mean of Side 1 and Side 2 Qinner, separately calibrated at 60keV |
| Phonon energy based on unbalanced Psum, calibrated at 60 keV |
| Cuts: randoms removed, charge symmetry, Q-inner both sides, Q-chisq both inner channels |
| blue is “good” series, red is “bad” series… |
| Time distribution of q-symmetric events leaking into NR band |
|---|
| for background data taken Sep 30-Oct 1, -4V/+4V |
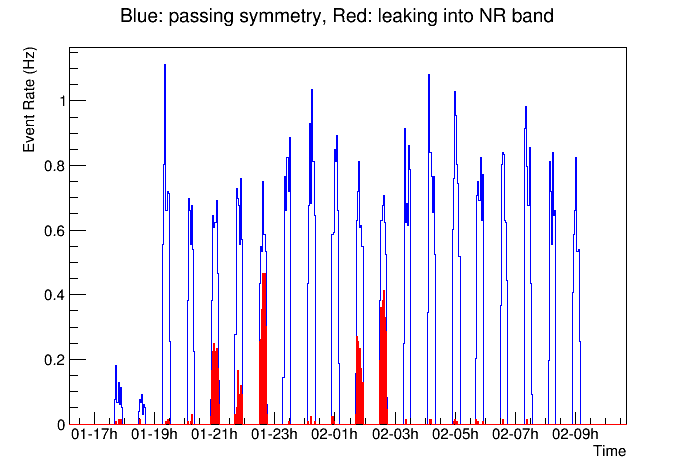 |
| Cuts: randoms removed, charge symmetry, Q-inner both sides, Q-chisq both inner channels |
| red is events leaking into NR band |
| compare with PSD trends |
| Yield versus recoil energy for background data taken Sep 30-Oct 1, -4V/+4V |
|---|
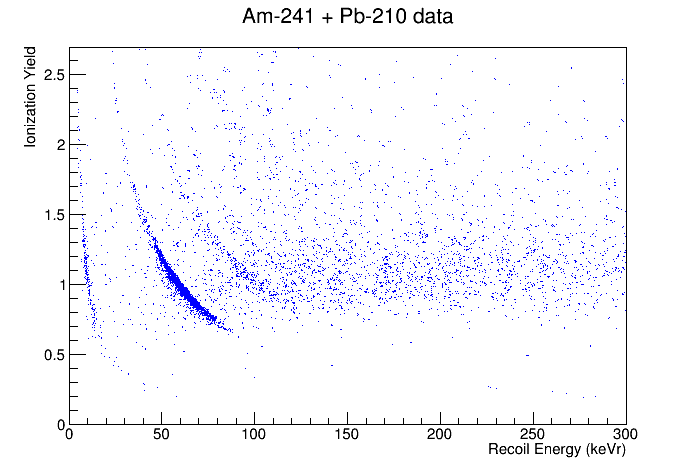 |
| “good” series only |
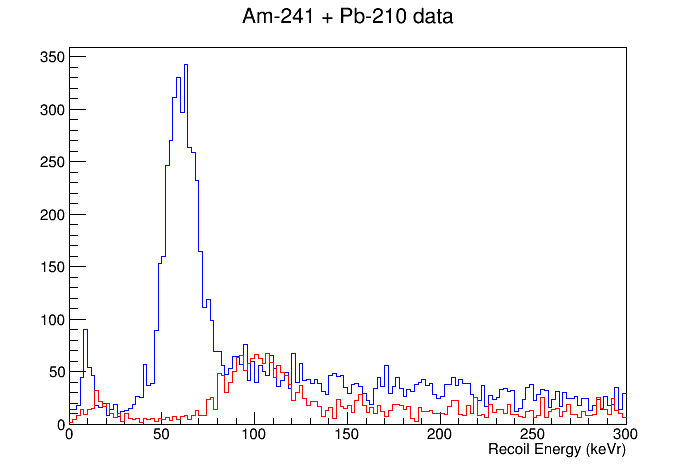
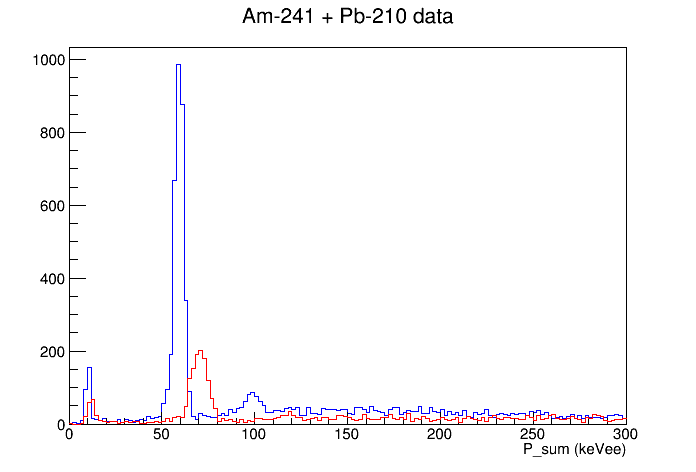
| Energy spectra of q-symmetric events for background data taken Sep 30-Oct 1, -4V/+4V |
|---|
 |
 |
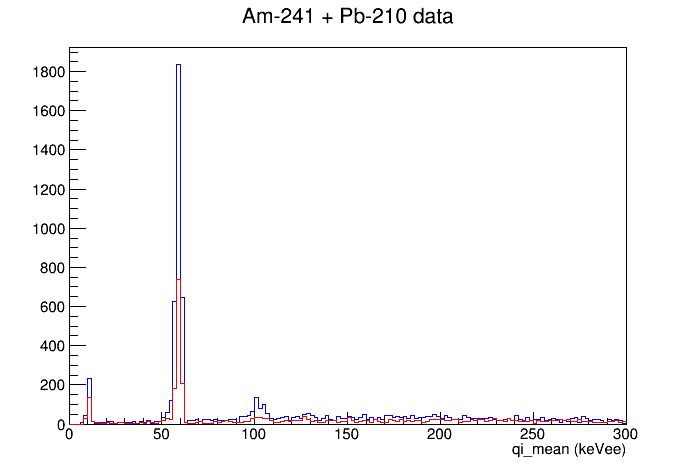 |
| blue is “good” series, red is “bad” series… |
| Yield versus recoil energy for background data taken Sep 30-Oct 1, -4V/+4V |
|---|
| q-symmetric and non-Am surface events |
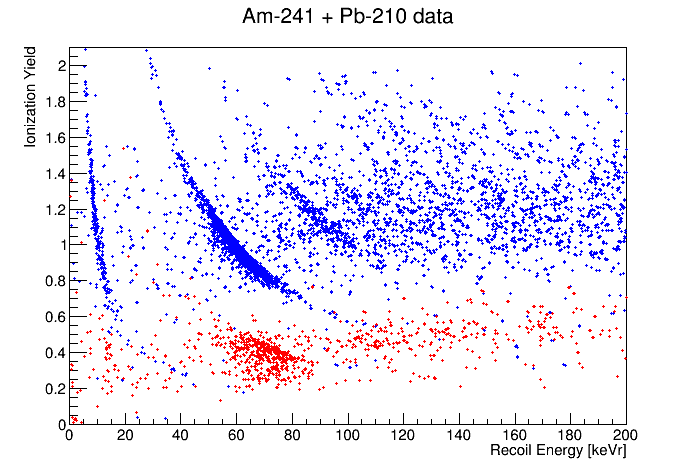 |
| THIS PLOT IS WRONG, see below |
| 20 series (5 hours of data, 15 hours of running) |
| Cuts: randoms removed, Q-inner both sides, Q-chisq both inner channels |
| blue: pass q-symmetry |
| red: side1 surface events (according to qzpart) with an attempt to remove Am events by position |
| note that many 60 keV Am events leak into the Am-removing cut |
| number of non-Am surface events from 5-100 keV but *not* 55-88 keV: 185 surface events |
| Yield versus recoil energy for background data taken Sep 30-Oct 1, -4V/+4V |
|---|
| q-symmetric and Side 2 surface events |
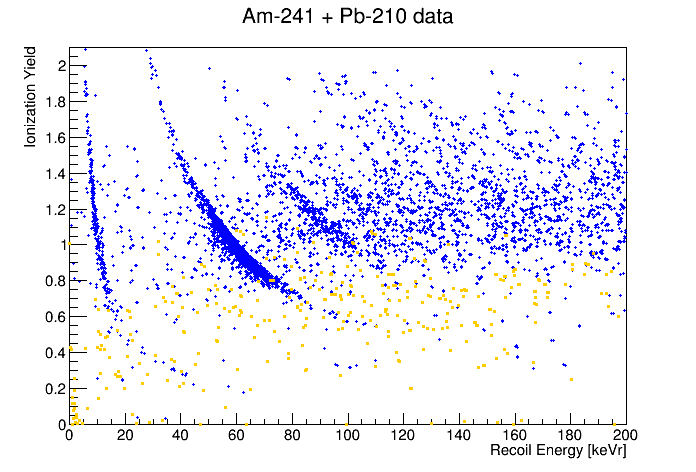 |
| THIS PLOT IS WRONG, see below |
| 20 series (5 hours of data, 15 hours of running) |
| Cuts: randoms removed, Q-inner both sides, Q-chisq both inner channels |
| blue: pass q-symmetry |
| orange: side2 surface events (according to qzpart) |
| number of Side 2 surface events from 5-100 keV: 186 surface events |
Reconstructing Recoil Energy and Yield
The two plots above used an incorrect reconstruction of yield. The recoil energy reconstruction is nominally right, although a small crosstalk correction improves it.
Assume we have calibrated quantities Pt, Q1, and Q2. These are the total phonon, the side 1 inner charge, and the side 2 inner charge. They are each calibrated using bulk (q-symmetric) gamma lines, so each is a representation of recoil energy in keVee, correct for bulk events.
The recoil energy can then be reconstructed as
Er = (1+2V/v_e)Pt - V/v_e(Q1+Q2)
The first term is the total phonon energy in keV. “V” is the (positive) bias voltage on one side, with the assumption that the opposite bias is applied to the other side. v_e is 3.0 V, the energy to produce one e/h pair in an electron recoil. So the first term simply recalibrates Pt back to total phonon energy rather than electron-equivalent recoil energy.
The second term is the Luke phonon energy. Note that in a symmetric event, where Q1=Q2, the charge is multiplied by 2V, representing the full potential difference between the two sides of the crystal. In a pure one-side event, where Q1=0 or Q2=0, the charge is only multiplied by V, representing the potential difference between the bias rail and the ground rail on one side. For “shared” events where some charge is collected on one side, the rest through the bulk, then the formula correctly calculates the Luke energy from the two contributions.
The original recoil energy formula I used was intended only for bulk events, but it turns out it is identical to the correct version above:
Er = (1+2V/v_e)Pt - 2V/v_e(Qmean)
where Qmean is the average of Q1 and Q2.
I did find however that there is a bias with depth. For the 60keV line, this formula correctly produces a peak at 60 keV for central events, but it drifts linearly to about 67 keV as zqpart approaches 1 (i.e. the closer you get to side 1 in terms of charge side partition). An empirical correction removes this bias:
Er = (1+2V/v_e)Pt - V/v_e(1.081*Q1+0.919*Q2)
This is similar to a “crosstalk” correction.
As for yield, the correct definition is
Y ≡ v_e×Q/Er
where Q here is the actual ionized charge (in Coulombs) produced in the event. In an iZIP the best representation of Q is the maximum of the two charge quantities, since in an asymmetric event the near side charge signal should represent the full charge collection while the far side signal will be reduced. So the reconstruction formula is
Y = Qmax/Er
(Of course Qmax will reflect the total collected charge. If there is reduced collection, such as for an event in a “dead layer”, then Qmax will not reflect the actual ionized charge, thus the measured yield will be low - the standard reduced-yield surface effect.)
In the plots above I made the mistake of setting Y = Qmean/Er. This artificially lowers the yield for surface events by averaging in the near-zero far-side charge energy. The corrected plots for surface events and symmetric events are shown below:
| Yield versus recoil energy for background data taken Sep 30-Oct 1, -4V/+4V |
|---|
| q-symmetric and non-Am surface events (corrected) |
 |
| 20 series (5 hours of data, 15 hours of running) |
| Cuts: randoms removed, Q-inner both sides, Q-chisq both inner channels |
| blue: pass q-symmetry |
| red: side1 surface events (according to qzpart) with an attempt to remove Am events by position |
| note that many 60 keV Am events leak into the Am-removing cut |
| number of non-Am surface events from 5-100 keV but *not* 55-88 keV: 185 surface events |
| Yield versus recoil energy for background data taken Sep 30-Oct 1, -4V/+4V |
|---|
| q-symmetric and Side 2 surface events (corrected) |
 |
| 20 series (5 hours of data, 15 hours of running) |
| Cuts: randoms removed, Q-inner both sides, Q-chisq both inner channels |
| blue: pass q-symmetry |
| orange: side2 surface events (according to qzpart) |
| number of Side 2 surface events from 5-100 keV: 186 surface events |
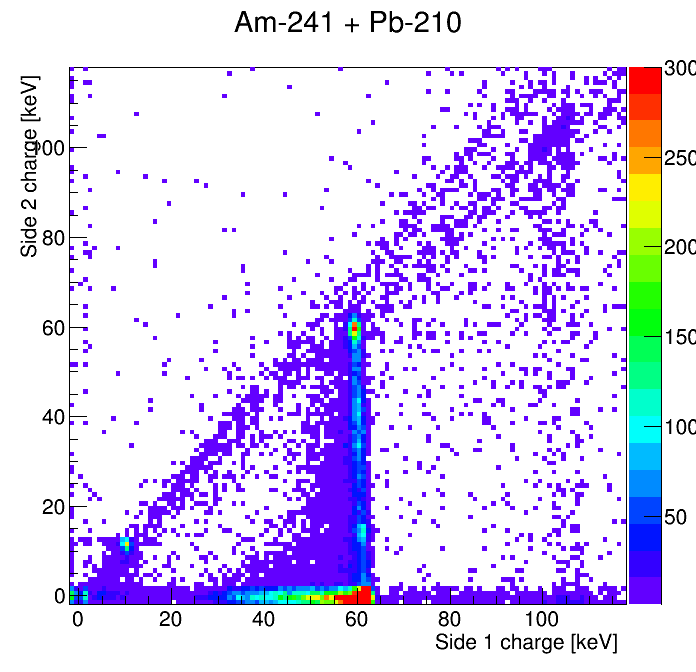
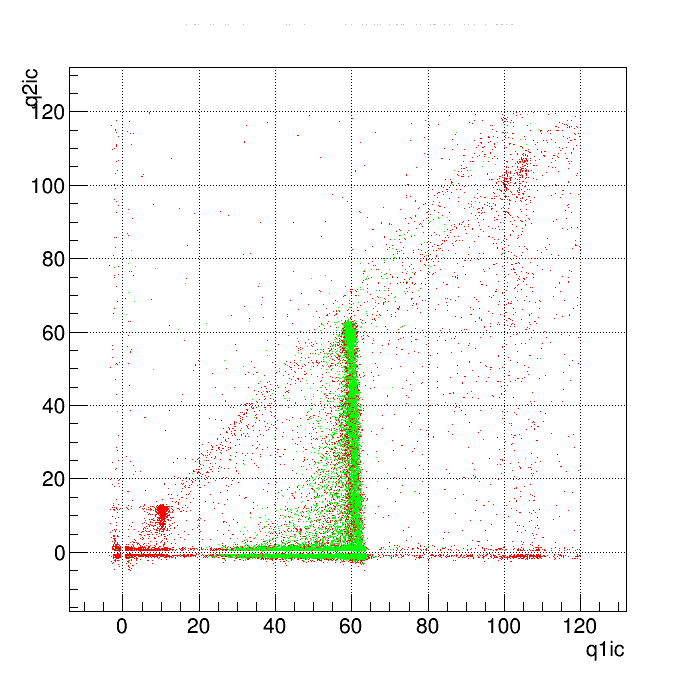
Q2 versus Q1 in background data
| Side2 qInner versus Side1 qInner for background data taken Sep 30-Oct 1, -4V/+4V | |
|---|---|
| density plot | scatter plot, green is events with recoil energy ~60keV |
 |  |
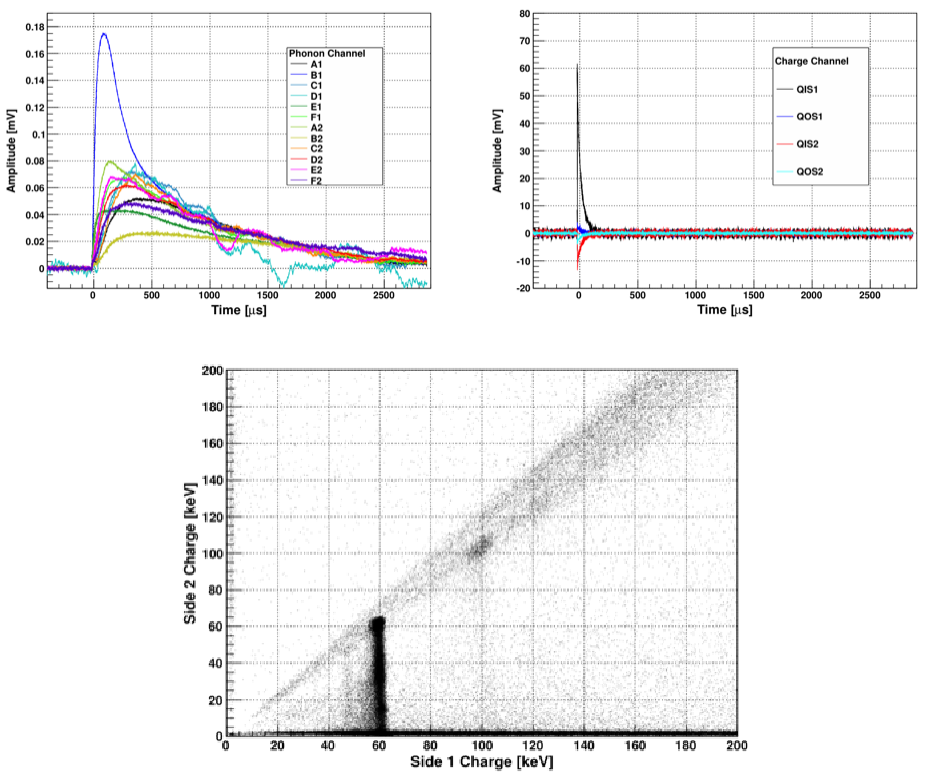
| Hassan's plots from older data, hint of 46keV gamma from Pb-210 chain |
|---|
 |
| Side2 qInner versus Side1 qInner for background data taken Sep 30-Oct 1, -4V/+4V | |
|---|---|
| various zooms. for highest energies, chisquare cuts are turned off. | |
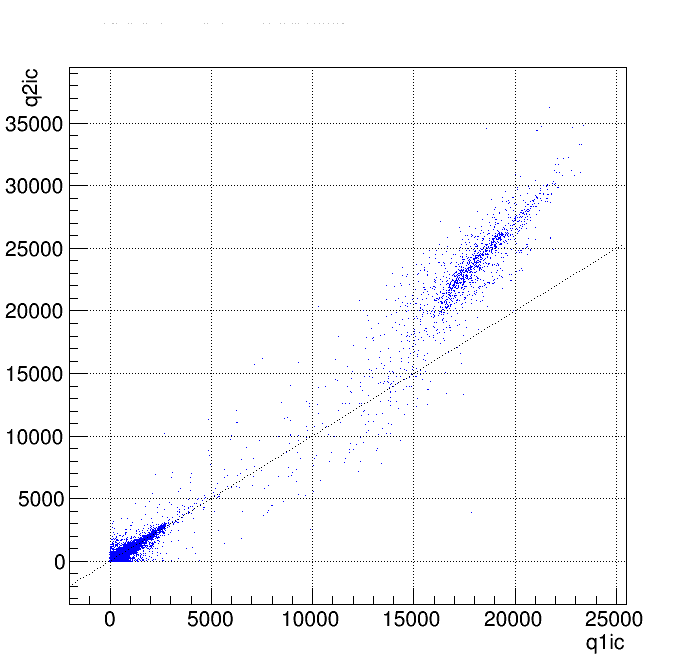 | 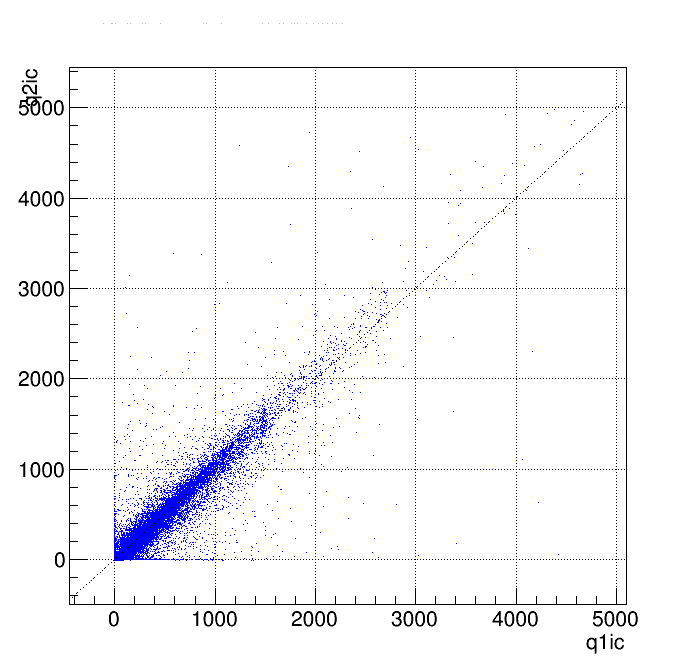 |
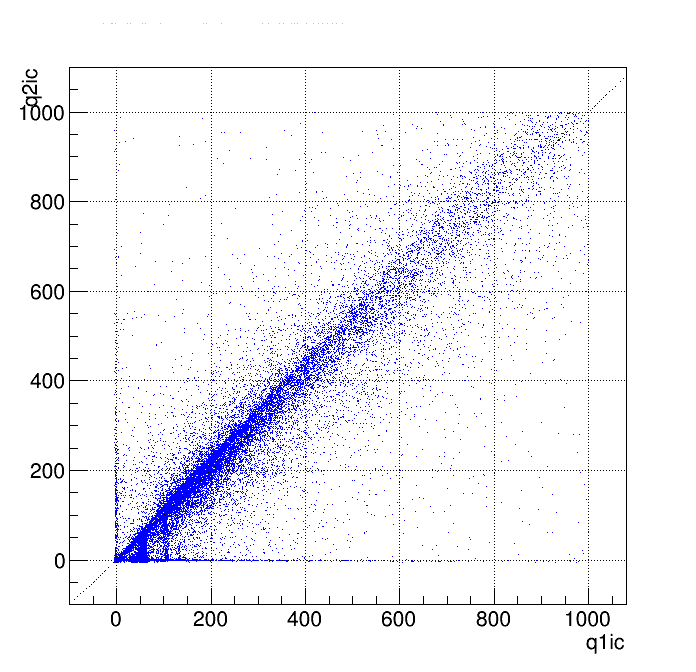 | 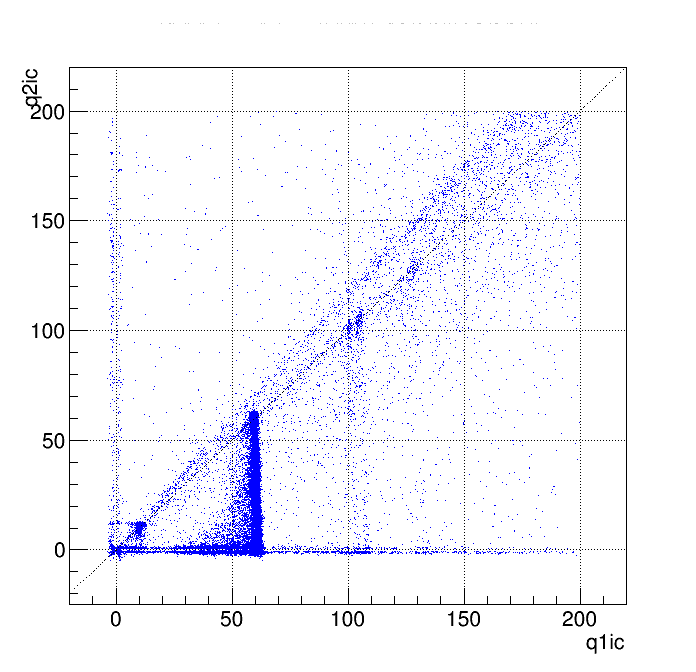 |
Plots from Run 46 data
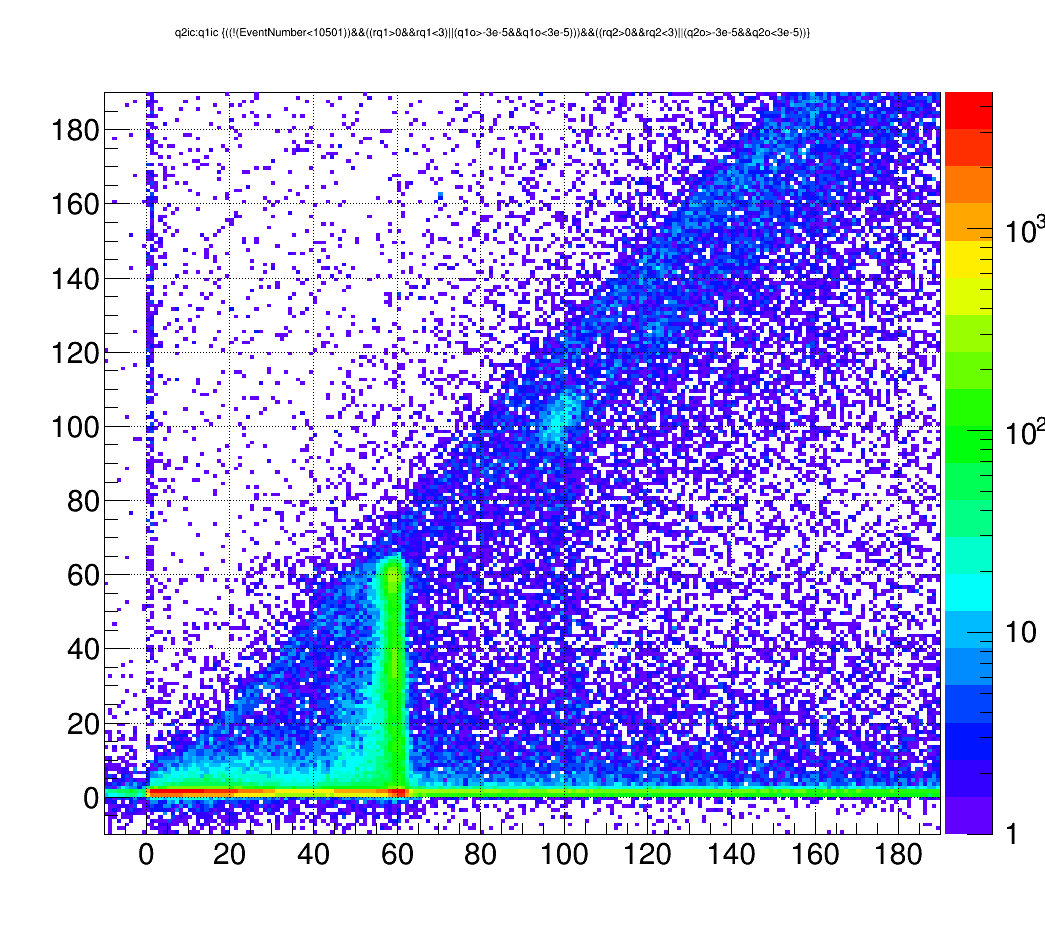
| Run 46, Am&Pb, -3.5/3.5 V, 2014 May 9-14 | |
|---|---|
| looks like Hassan's plot | |
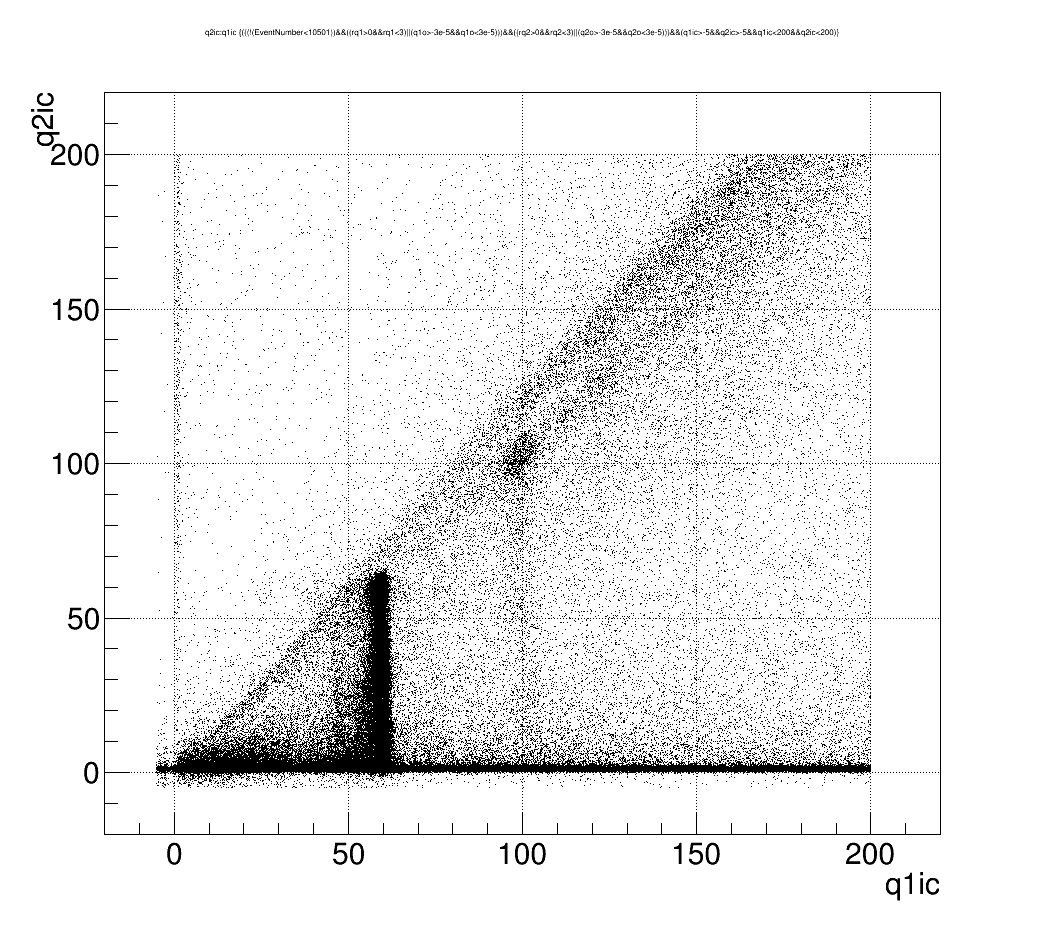 |
|
| note on processing: DIB-mapped rather than side-mapped format, processed 2014 May | |
| OFnoX charge quantities have very different calibration constants (maybe just a gain setting in processing?) | |
 |
|
| zoom out to 4 MeV charge energy | |
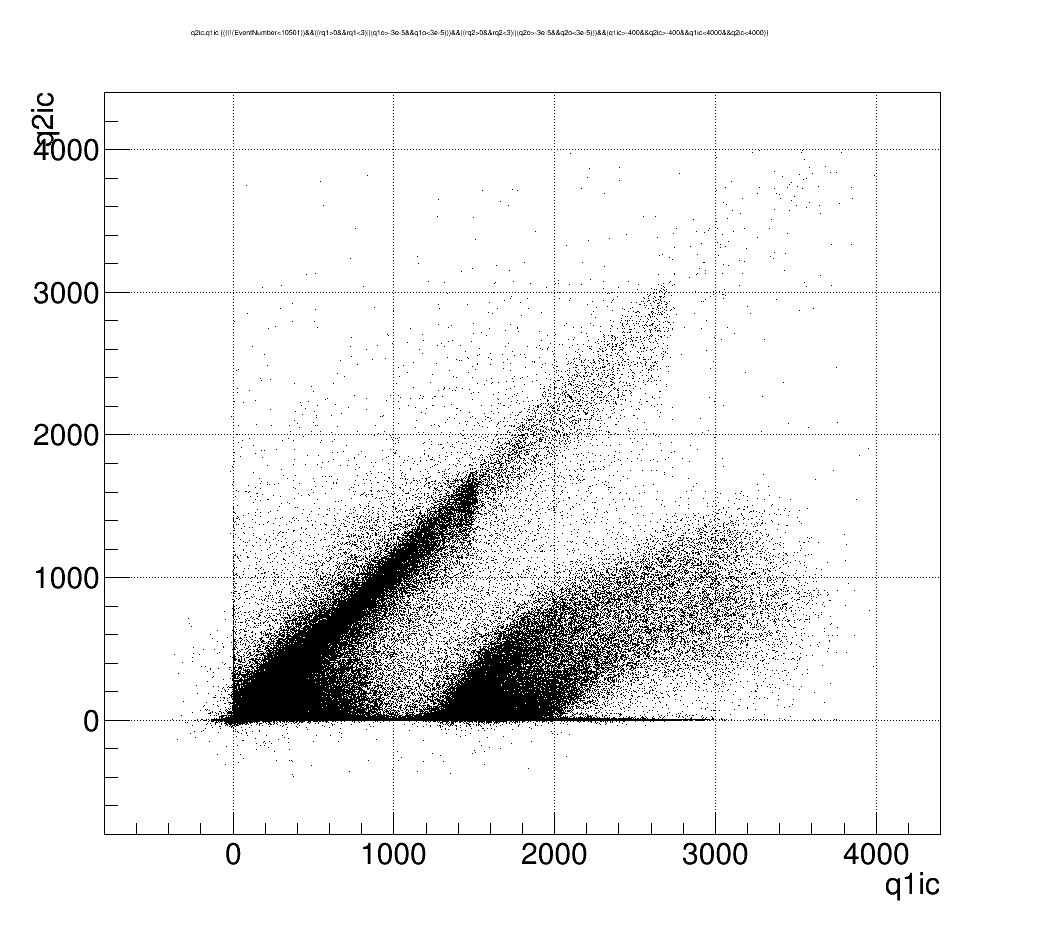 | 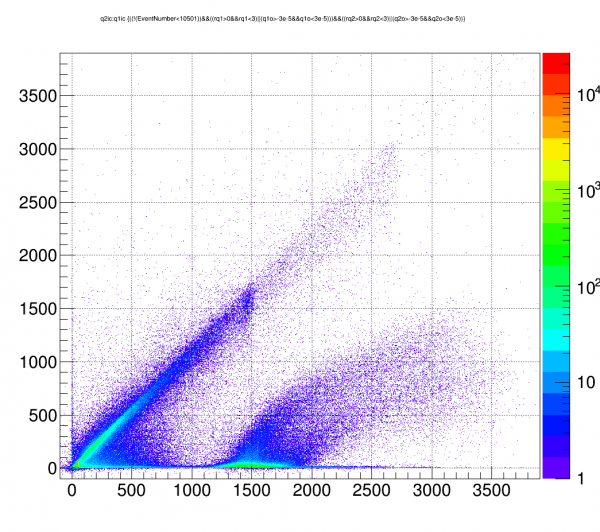 |
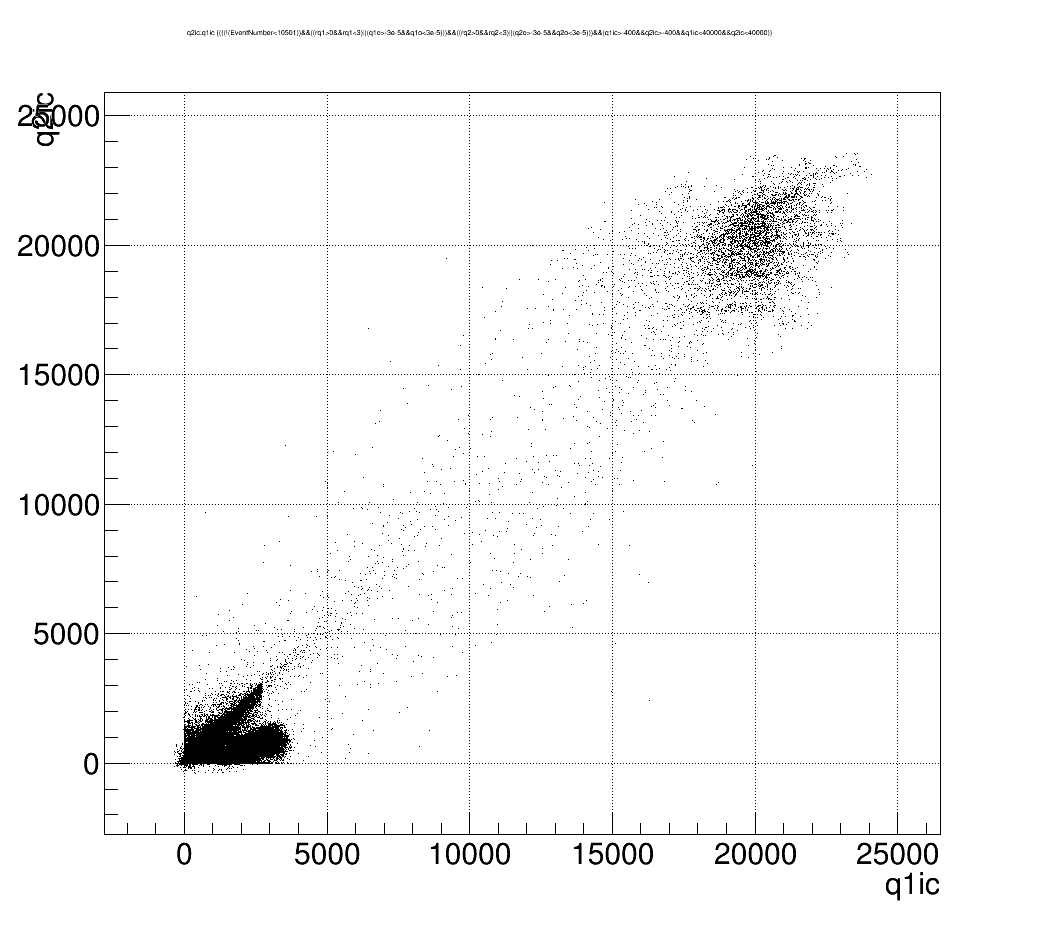
| 5.3 MeV alphas (probably) appear as region on Side 1 (intrinsic yield ~0.6 , reduced charge collection brings yield down to ~0.3) | |
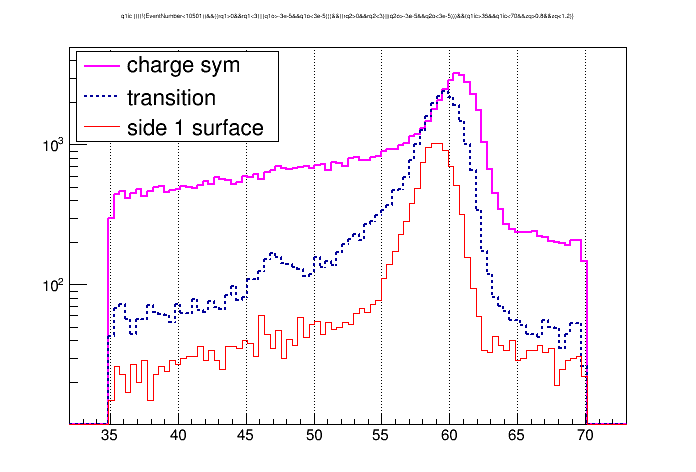
| zoom out to see muons | hunt for very faint 46.5keV gamma line |
 |  |
Counts from Run 46 sample versus Run 54 sample
| Run 46 | Run 54 | |
|---|---|---|
| live time: | 74300 s (21 hours) | 14500 s (4 hours) |
| muon rate: | 0.087 Hz, 1/(12 s) | 0.199 Hz, 1/(5 s) |
| alpha rate: | 3.1 Hz | ≤ 0.012 Hz |
| alpha/muon: | 36 | ≤ 0.06 |
| 46.5 keV rate (peak over background): | ~0.01 Hz | not seen |
| 46.5keV gamma rate should be 3.4% of alpha rate = 0.1 Hz so only seeing about 10% of them | ||
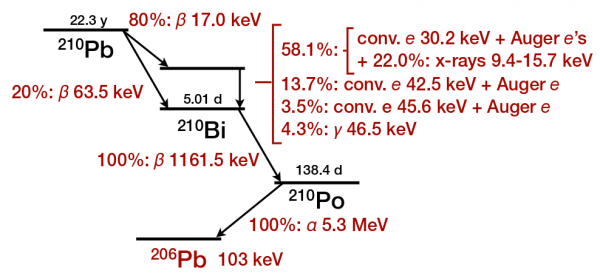
Is our Pb-210 source mounted backward??
Run 36, 2013 March 6 diary shows pictures of lead source, front (Figure 2) and back (Figure 3). The front (active) side should be identifiable from “a hint of where the o-ring was”. But there seems to be a ring shape on both sides.
I don't remember precisely but it seems like the side mounted to face the detector when we assembled for Run 53 was dirtier looking than the opposite side. But my main assumption was that the way the source was mounted in the holder was probably correct, since there would be no reason to change it between runs. However Allison points out that the source may have been removed from the holder during the move to PAN, then possibly remounted at some point by someone unaware of the correct orientation.
In an email exchange with Hassan he agrees that it's possible that the source is backwards. On the topic of how to identify the active side he writes “It is more of a pronounced ring than that on the inactive side. I'm not sure of any other way to tell which side is which unless one of us stuck some tape on the inactive side. We would never stick tape on the active side.” I'm pretty sure there is currently no tape on either side of the source.
Update: upon disassembly it turns out that there is indeed a piece of tape on the side of the Pb source facing the detector - it was mounted backwards in the source holder plate. See the 2015/11/20 diary entry.
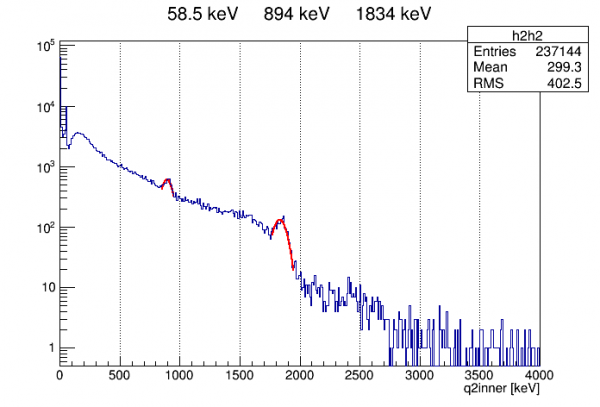
Y-88 data
 | 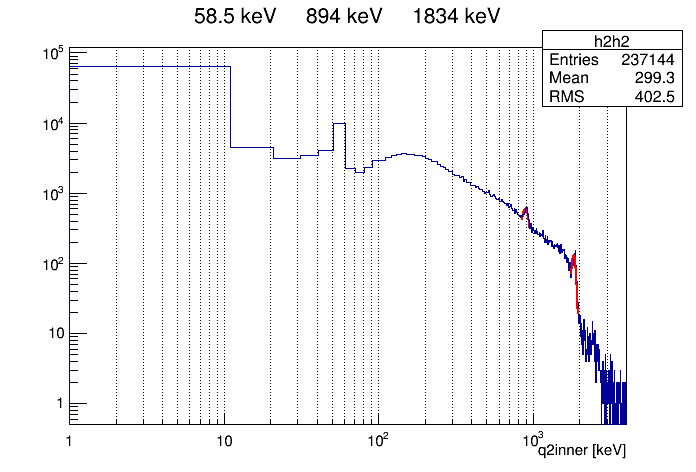 |