Run 52
2015/04/21 through 2015/05/27 (5.3 weeks)
summary for tower meeting
The first run in the new laboratory was dedicated to testing G110, an iZIPv6 n-type crystal from Ortec, fabricated by TAMU. Critical temperatures of the TESs were measured, charge breakdown was investigated and IbIs measurements were taken. Due to issues with the DCRC boards and a interference pattern on DIB1 (Stripline 19, SQUET ZC13 and Side coax ZB1-6), data was not taken. A mixing chamber temperature of 52 mK was achieved during this run. The setup is summarized in Table 1.
| Table 1: Run 52 setup |
| Detector | G110 |
| Tower | T1 |
| DIB | 1 | 2 | 3 |
| Face | 2 | 5 | 6 |
| Side coax | ZB1-6 | ZB1-1-9 | ZB1-1-11 |
| SQUET | ZC13 | ZC70 | ZC23 |
| Stripline | #19 | #27 | #20 |
| Readout | DCRCv3 and DCRCv3.1 |
| Source | 1 x Am-241 & 1 x Pb-210 |
Higher Base Temperature
A higher base temperature was seen in this run compared to the previous two runs with no tower. The tower-MC temperature difference was also higher than it should be. It appears that the main problem was a heat leak to the 100mK stage from a warmer stage. An analysis of the thermal situation is here:
Thermal Analysis of Run 52
Copied below are data tables relevant to cryogenics copied from the run diary:
| Table 2: 2015/05/08 Cooling Power Test |
| time | MC heat | Still heat | MC temp | Tower temp |
| 1020 | 0 uW | 4 mW | 55 mK | 73 mK |
| 1056 | 200 uW | 15 mW | 148 mK | 155 mK |
| 1107 | 180 uW | 15 mW | 157 mK | 164 mK |
| 1116 | 160 uW | 15 mW | 144 mK | 152 mK |
| 1132 | 140 uW | 15 mW | 136 mK | 143 mK |
| 1150 | 120 uW | 15 mW | 128 mK | 137 mK |
| 1215 | 100 uW | 15 mW | 116 mK | 124 mK |
| 1235 | 80 uW | 15 mW | 113 mK | 122 mK |
| 1251 | 60 uW | 15 mW | 102 mK | 111 mK |
| 1302 | 40 uW | 15 mW | 92 mK | 103 mK |
| 1326 | 20 uW | 15 mW | 75 mK | 89 mK |
| 1344 | 0 uW | 15 mW | 56 mK | 74 mK |
| Table 3: 2015/05/18 Tower/MC temperature difference measurement |
| MC temperature | Tower temperature |
| 53.5 mK | 67.9 mK |
| 60 mK | 71 mK |
| 72 mK | 82.5 mK |
| 84 mK | 91 mK |
| 89 mK | 97 mK |
| 100 mK | 105 mK |
| 107 mK | 114 mK |
Tc, Rn, Rp Measurements
The tables below briefly summarize the measured critical temperatures, normal resistances, and parasitic resistances for the phonon channels of G110. The first is sorted by DIB and the second is sorted by side.
| Table 4: Phonon channel measurement summary (sorted by DIB) |
| DIB | Channel | Rp (mΩ) | Rn (Ω) | Tc (mK) | Twidth (mK) |
| | | | | | |
| DIB1 | pA | 13 | 2.1 | 109 | 5 |
| DIB1 | pB | 12 | 0.9 | 106 | 2 |
| DIB1 | pC | 11 | 1.5 | 107 | 5 |
| DIB1 | pD | 60 | 7.0* | 110 | 4 |
| | | | | | |
| DIB2 | pA | 13 | 1.1 | 99 | 4 |
| DIB2 | pB | 16 | 1.9 | 108 | 5 |
| DIB2 | pC | 13 | 1.1 | 95 | 5 |
| DIB2 | pD | 33 | 2.4 | 110 | 6 |
| | | | | | |
| DIB3 | pA | 13 | 0.9 | 93 | 2 |
| DIB3 | pB | 16 | 1.2 | 109 | 3 |
| DIB3 | pC | 19 | 1.4 | 102 | 5 |
| DIB3 | pD | 13 | 0.8 | 96 | 3 |
| Table 5: Phonon channel measurement summary (sorted by side) |
| Side | Channel | Rp (mΩ) | Rn (Ω) | Tc (mK) | Twidth (mK) |
| | | | | | |
| Side 1 | pA | 33 | 2.4 | 110 | 6 |
| Side 1 | pB | 13 | 2.1 | 109 | 5 |
| Side 1 | pC | 11 | 1.5 | 107 | 5 |
| Side 1 | pD | 13 | 1.1 | 95 | 5 |
| Side 1 | pE | 19 | 1.4 | 102 | 5 |
| Side 1 | pF | 12 | 0.9 | 106 | 2 |
| | | | | | |
| Side 2 | pA | 16 | 1.9 | 108 | 5 |
| Side 2 | pB | 13 | 0.9 | 93 | 2 |
| Side 2 | pC | 13 | 1.1 | 99 | 4 |
| Side 2 | pD | 60 | 7.0* | 110 | 4 |
| Side 2 | pE | 13 | 0.8 | 96 | 3 |
| Side 2 | pF | 16 | 1.2 | 109 | 3 |
* For DIB1 pD the IbIs curve was not extended to high enough Ib to accurately calculate the normal resistance. The value shown is an upper limit - the true value is likely smaller but it is probably greater than 2.5 Ω.
The Rn and Rp values are based on IbIs measurements. Calculation of the resistances from slopes in the raw curve depends on assumed values of the phonon circuit components and the DCRC gains. DCRC50 (Rev C.1) was used to produce all of the IbIs curves. It has been noticed in the past that when using DCRC50 the calculated Rn's are higher than when using Rev C.0 boards, suggesting that there is some incorrect assumption about how DCRC50 works. Thus the resistance values above may be higher than the true values.
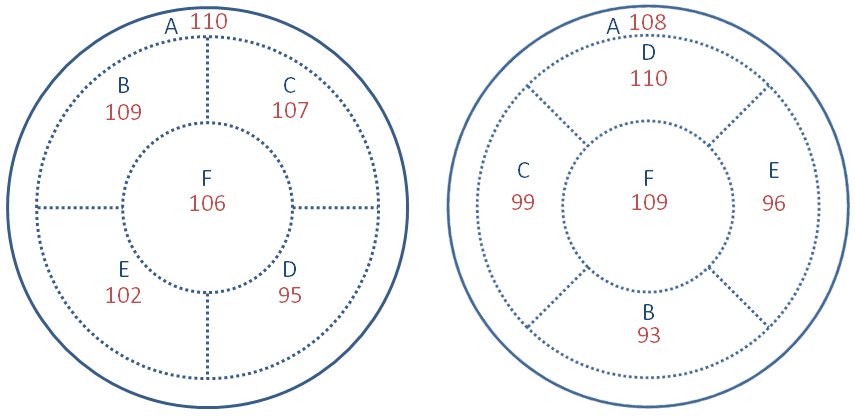
Below is a map of Tc's (in mK) on the detector surfaces. There seems to be a slight tendency toward lower Tc's toward the bottom of the figure (toward DIB2) on both sides. Other trends noticed are a correlation between Tc and Rn and between Rp and Rn.
| Figure 1: Tc map (in mK) |
 |
Tc measurement details
All TC Measurement test were performed with a the same DCRC board connected to the EBox - DCRC33 (rev C). A 10 mVpp / 100 Hz triangle wave was sent down the four QET lines and the phonon channels were observed as the MC was heated and then allowed to cool again. The transition region was taken as the temperature range in which the triangle waveform was distorted by pulses (below and above this range an undistorted triangle wave is observed). The lower end of the region was taken as the critical temperature, averaging the two values from warming and cooling. Temperatures were monitored at the MC thermometer; tower thermometer temperatures were inferred based on previous measurements of tower-versus-MC temperature taken over a range of base temperatures. As explained below it was determined that the temperature measured at the tower is a good indication of the crystal temperature, so the tower temperature was used to determine Tc.
The tables below are raw data copied from the run diary.
| Table 6: Tc measurements for DIB1 (DCRC33) - temperatures at MC / inferred temperatures at Tower |
| | Temperature range in which waveform is distorted |
| Channel | During heating | During cooling |
| A | 100-105 mK / 110-115 mK | 98-103 mK / 108-113 mK |
| B | 96-97 mK / 107-108 mK | 93-95 mK / 104-106 mK |
| C | 97-102 mK / 108-112 mK | 94-100 mK / 105-110 mK |
| D | 101-105 mK / 111-115 mK | 99-102 mK / 109-112 mK |
| Table 7: Tc measurements for DIB2 (DCRC33); - temperatures at MC / inferred temperatures at Tower |
| | Temperature range in which waveform is distorted |
| | During heating | During cooling |
| Channel | 5/8 measurement | 5/18 measurement | 5/8 measurement | 5/18 measurement |
| A | 91 mK / 102 mK | 94-99 mK / 101-105 mK | 86 mK / 98 mK | 89-93 mK / 96-100 mK |
| B | 99 mK / 109 mK | 104-110 mK / 110-116 mK | 96 mK / 107 mK | 100-104 mK / 106-110 mK |
| C | 87 mK / 99 mK | 90-95 mK / 97-102 mK | 82 mK / 95 mK | 86-90 mK / 93-97 mK |
| D | 100 mK / 110 mK | 106-111 mK / 112-117 mK | 97 mK / 108 mK | 107-101 mK / 107-113 mK |
Note: DIB2 Tc's were measured twice - 2015/05/08 and 2015/05/18. For the both measurements the tower temperatures were inferred from the cooling power test done on the same day; the tower-MC temperature difference is rather smaller in the latter test. The two Tc measurements agree well when you use the corrected tower temperatures, but not so well if you use the measured MC temperatures. This suggests that the crystal is much closer to the tower thermometer temperature than the MC temperature.
| Table 8: Tc measurements for DIB3 (DCRC33) - temperatures at MC / inferred temperatures at Tower |
| | Temperature range in which waveform is distorted |
| Channel | During heating | During cooling |
| A | 82-85 mK / 95-96 mK | 78-81 mK / 91-94 mK |
| B | 100-103 mK / 110-113 mK | 98-100 mK / 108-110 mK |
| C | 92-98 mK / 103-108 mK | 88-94 mK / 100-105 mK |
| D | 85-88 mK / 97-100 mK | 81-84 mK / 94-96 mK |
Charge Breakdown Measurements
The table below summarizes the minimum voltages at which charge breakdown symptoms were observed. Various polarities for sides 1 and 2 were tested. In some trials higher breakdown voltages were seen (shown in the second column) but these were not repeatable: the smaller values in the first column seem more reliable. Voltages were modified in 0.5 V steps.
| Table 9: Charge breakdown minimum voltages |
| DIB1/DIB2 polarity | Repeatable breakdown voltage | Highest seen breakdown voltage |
| 0/- | 0.0 V / -5.5 V | |
| 0/+ | 0.0 V / +8.5 V | 0.0 V / +9.5 V |
| -/0 | -4.0 V / 0.0 V | -8.0 V / 0.0 V |
| +/0 | > +13.0 V / 0.0 V | |
| -/+ | -4.0 V / +4.0 V | -8.5 V / +8.5 V |
| +/- | +5.5 V / -5.5 V | |
The measurements in this table were performed on 2015/05/19 using DCRC31 and DCRC33 (both Rev C) and using voltage calibration tables to set true voltages rather than the nominal DCRC settings. The method was to watch pulses on DIB1 as the charge bias was adjusted. This allowed us to observe phonon pulses on Side 1 (A, B, C) and Side 2 (D), none of which are outer-ring channels. The observed breakdown symptoms were just pulse-less noise in the phonon channels, and “spiky” forms in the charge channels with no normal pulses. Also the tower temperature increases a few mK. Earlier measurements with different DCRCs and nominal voltage settings were done on 2015/05/08 and 2015/05/12 and show essentially consistent results.
Interference Problem
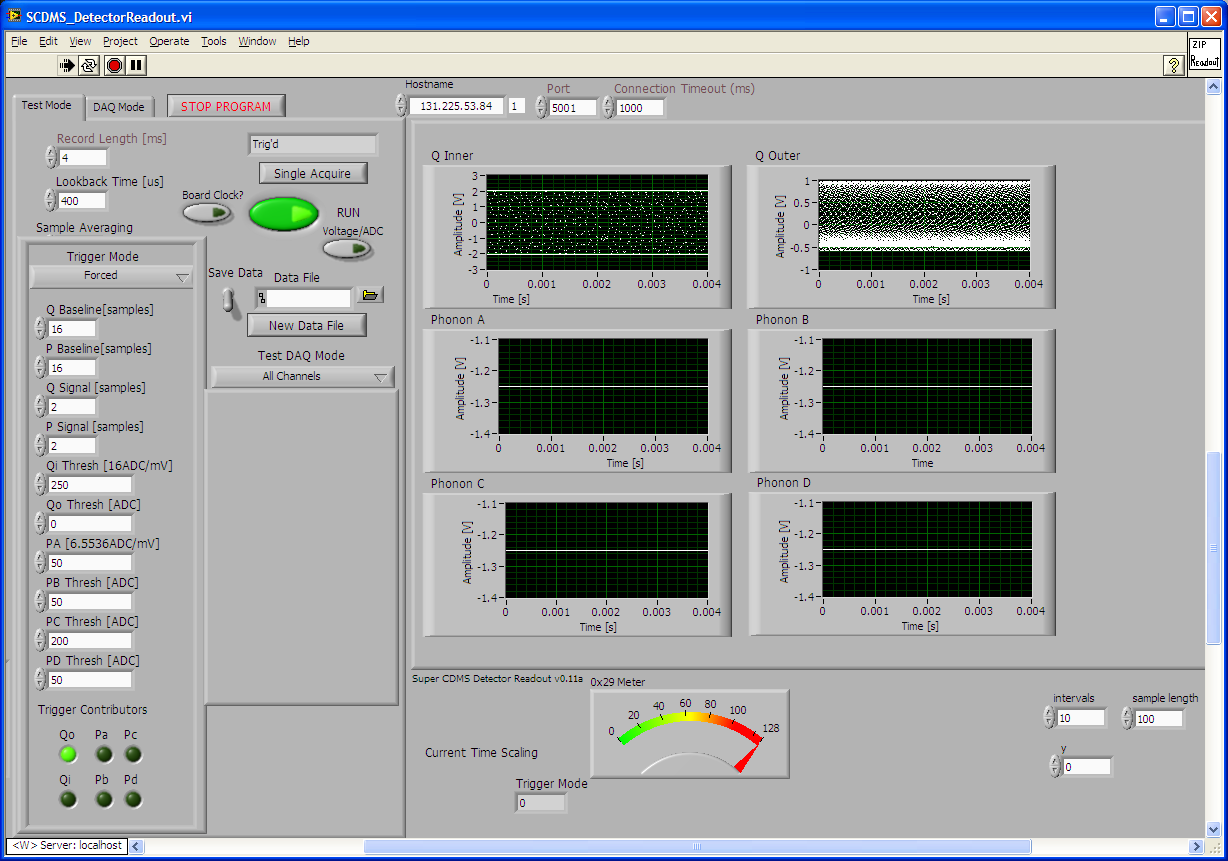
This run was plagued with a high amplitude oscillation recurrently appearing in the DIB1 Qinner channel and at smaller amplitudes in the other charge channels. We refer to it as the interference problem or interference pattern for no particular reason.
Key Details:
The pattern is ~110 kHz, strongly saturated on DIB1 Qi, around 2 Vpp on DIB1 Qo, and around 0.2 Vpp on both DIB2 Qi and Qo.
When the problem occurs the tower temperature rises significantly.
Turning off the power to the DIB1 FETs always gets rid of the problem.
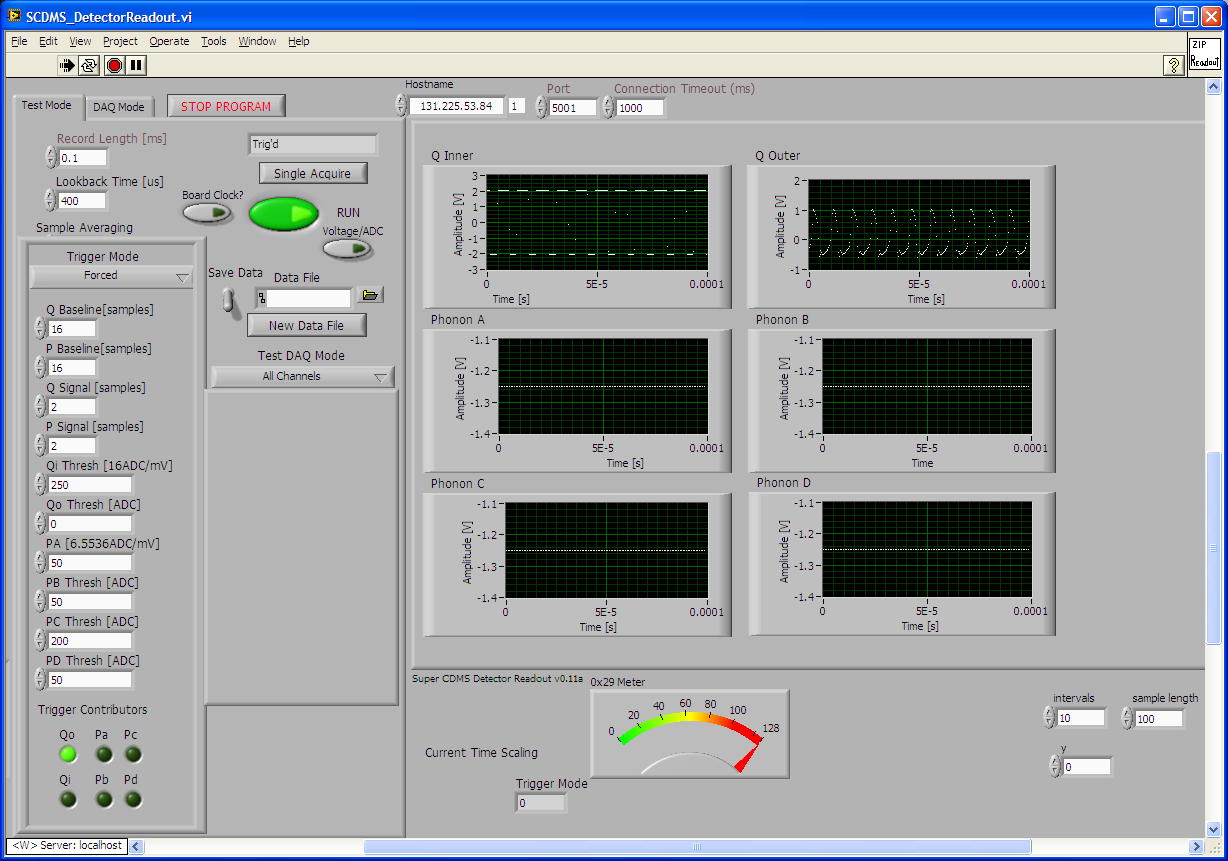
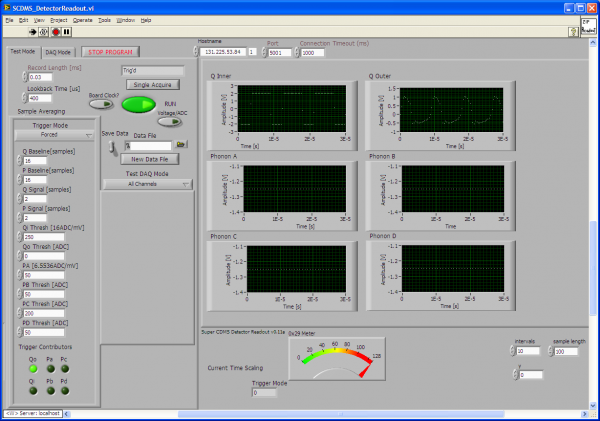
The images below are screen caps of the interference problem as it appears in the charge traces. In this case the phonons are flatlined, which occurs when the interference appears if they are set to high gains: otherwise we typically see pulse-less noise in the phonons. The images are from DIB1/DCRC33. The traces in the other DIBs show similar behavior when the interference problem is present. Click images for large version.
| Figure 1: Interference pattern in charge traces |
 |
| Figure 2: Time scale zoom: frequency apparently around 110 kHz |
 |
| Figure 1: Tighter time scale zoom |
 |
Diagnostics:
A similar problem was seen in Run 41 (see the figures on the Run 41 summary). In that run it appeared on DIB2 using either SQUET ZC-13 or ZC-23, but in both cases using the same side coax, ZB1-6, which was also used in this run on DIB1. So it seems that the side coax is the source of the problem.
Nader suggested that a leaky capacitor in the side coax could be responsible for the interference problem. We hooked up DIB1 and DIB2 for comparison to the breakout box and tried to check for this with the multimeter:
| +/- leads | DIB1, coax ZB1-6 | DIB 2, coax ZB1-1-9 |
| QiFB / QiBias | open | open |
| QiBias / QiFB | open | open |
| QiFB / QiDrain | 19 nS | 18 nS |
| QiFB / QiSource | 19 nS | 18 nS |
| QiDrain / QiFB | open | open |
| QiSource / QiFB | open | open |
so no obvious problem with DIB1 in this regard.
Other Details:
With DCRC50 (Rev C.1) the pattern would always appear immediately when the FETs were powered
With DCRC31 and DCRC33 (both Rev C) the FETs could be powered without the pattern appearing, at least for some amount of time, depending on other circumstances
With DCRC33 and DCRC31, the problem could be eliminated by power-cycling the FETs. The amount of time before it returned depended on other circumstances.
With DCRC31, leaving the FETs off resulted in further heating of the tower: they had to be turned back on to cool to base again.
With DCRC33 you could simply leave the FETs off, and the tower stayed cool
With DCRC33 you cannot set the charge biases if the FETs are off. (this was an empirical observation: there was no effect to changing the biases, even though querying the DCRC indicated the biases were set. Turning the FETs back on resulted in observable effects indicating they was an actual bias.)
The problem was worse (meaning it would reappear more quickly) under the following circumstances:
The pattern can be induced by plugging something into another DIB port while the DIB1 FETs were powered.
As far as we could tell the problem could be avoided indefinitely (and the DIB1 FETs left powered) if a Rev C board was used in DIB1, less than three DCRCs were in use, and no charge bias was applied.
Phonon Channel Noise Measurements
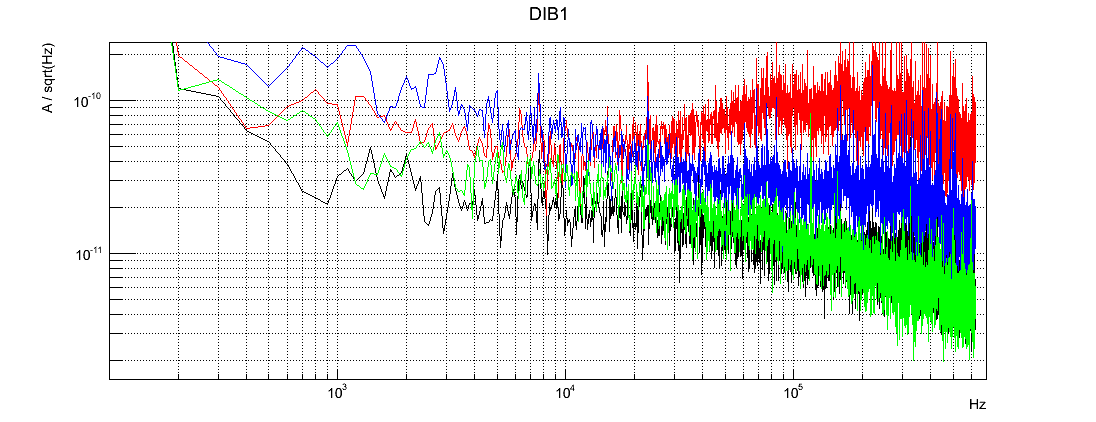
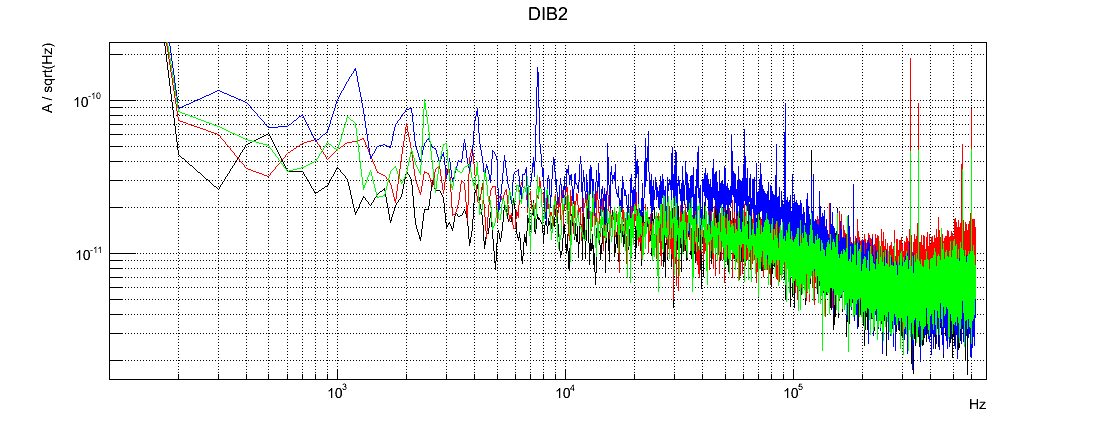
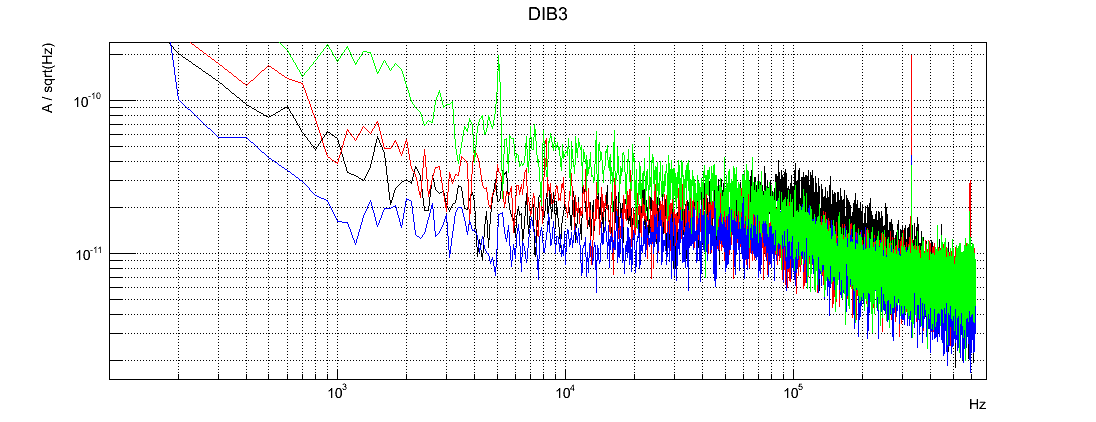
Noise PSDs were produced for all twelve phonon channels with appropriate SQUID settings and QET biases. DCRC50 (Rev C.1) was used in all cases so that any differences between DIBs (e.g. due to the stripline rerouting boards, present in DIB1 and DIB2) could be assessed. Five pulse-less traces 10 ms long were used for each channel. Front End Gains were set to 50 and Output Gains were set to 8.
Color code: black=pA, red=pB, blue=pC, green=pD
SQUID Lock Points
| DIB1 SQUIDs Lock Points using DCRC50, borrowed from DIB3 (since DCRC 31 was unusable), used 2015/05/08 |
| DIB1 DCRC50 | SQUID Bias [uA] | Lockpoint [mV] | Modulation Depth [Vpp] |
| A | -80.08 | -4.67 | .330 |
| B | -88.03 | -2.14 | .355 |
| C | -85.94 | -2.82 | .451 |
| D | -83.99 | -3.02 | .352 |
| DIB1 SQUIDs Lock Points using DCRC33, used 2015/05/11: |
| DIB1 DCRC33 | SQUID Bias [uA] | Lockpoint [mV] | Modulation Depth [Vpp] |
| A | 80.08 | 5.35 | .404 |
| B | 80 | 3.70 | .438 |
| C | 72 | 4.28 | .448 |
| D | 82.03 | 3.89 | .446 |
| DIB1 SQUIDs Lock Points using DCRC31, used 2015/05/18 |
| DIB1 DCRC31 | SQUID Bias [uA] | Lockpoint [mV] | Modulation Depth [Vpp] |
| A | 80.08 | 4.86 | .412 |
| B | 85.94 | 3.41 | .501 |
| C | 78.13 | 3.11 | .503 |
| D | 80.08 | 2.53 | .426 |
| DIB2 SQUIDs Lock Points using DCRC33, used 2015/05/07 |
| DIB2 DCRC33 | SQUID Bias [uA] | Lockpoint [mV] | Modulation Depth [Vpp] |
| A | 78.13 | 4.77 | .435 |
| B | 68.36 | 3.30 | .401 |
| C | 80.08 | 3.41 | .427 |
| D | 78.13 | 3.50 | .448 |
| DIB2 SQUIDs Lock Points using DCRC50, used 2015/05/12 |
| DIB2 DCRC50 | SQUID Bias [uA] | Lockpoint [mV] | Modulation Depth [Vpp] |
| A | -78.12 | -4.38 | .330 |
| B | -70.31 | -2.34 | .320 |
| C | -80.08 | -3.01 | .327 |
| D | -80.08 | -2.24 | .349 |
| DIB3 SQUIDs Lock Points using DCRC50, used 2015/05/07 |
| DIB3 DCRC50 (C.1) | SQUID Bias [uA] | Lockpoint [mV] | Modulation Depth [Vpp] |
| A | -82.03 | -4.77 | .340 |
| B | -80.08 | -3.31 | .327 |
| C | -87.89 | -2.72 | .382 |
| D | -82.03 | -3.40 | .350 |
| DIB3 SQUIDs Lock Points using DCRC33, used 2015/05/11 |
| DIB3 DCRC33 | SQUID Bias [uA] | Lockpoint [mV] | Modulation Depth [Vpp] |
| A | 82.04 | 5.93 | .446 |
| B | 86.94 | 4.28 | .484 |
| C | 89.85 | 3.41 | .519 |
| D | 89.85 | 3.31 | .522 |
| Figure 1: |
 |
| Figure 2: |
 |
| Figure 3: |
 |
| Figure 4: |
 |
| Figure 5: |
 |
| Figure 6: |
 |
| Figure 7: |
 |
| Figure 8: |
 |
| Figure 9: |
 |
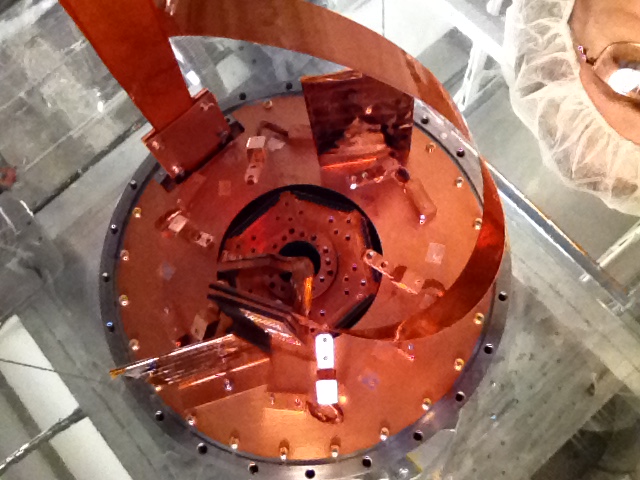
| Figure 10: |
 |
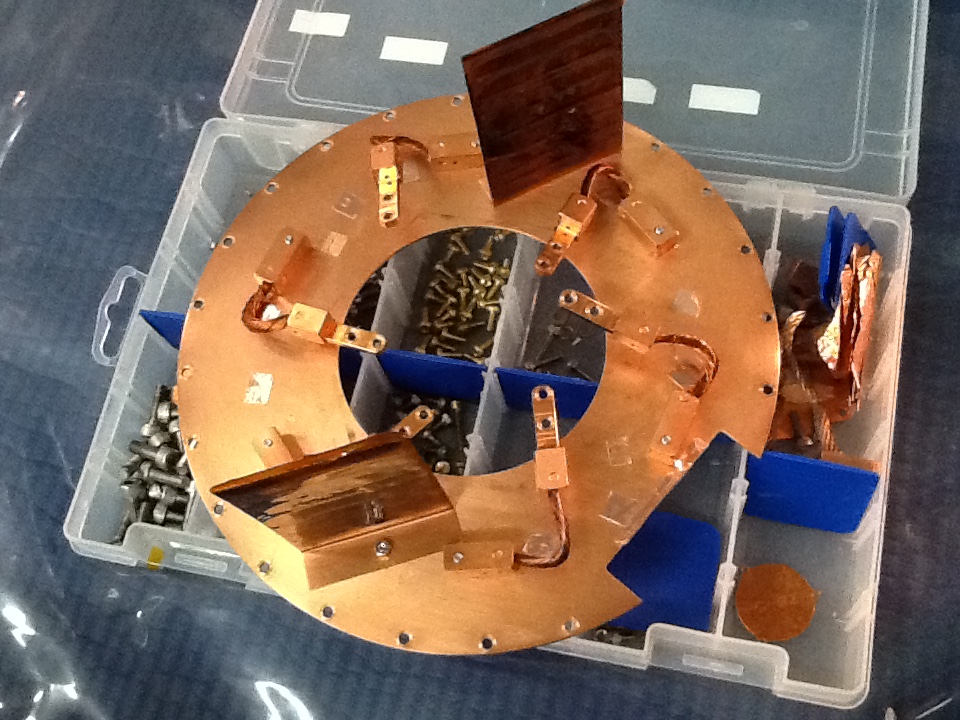
| Figure 11: |
 |
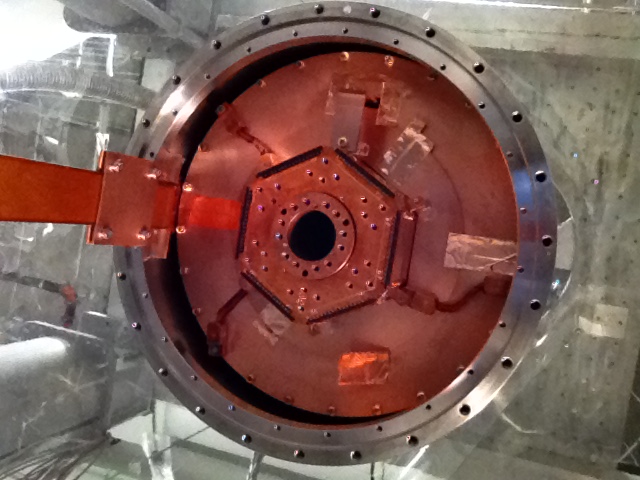
| Figure 12: |
 |
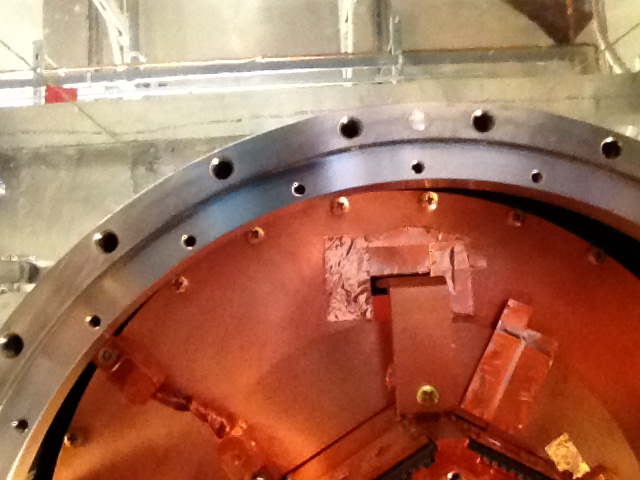
| Figure 13: |
 |
| Figure 14: |
 |
| Figure 15: |
 |
| Figure 16: |
 |
| Figure 17: |
 |
| Figure 18: |
 |