Table of Contents
Summary of Flexible Side Coax Test with TexCal Cable and Cable with Conductive Kapton Adhesive : Runs 27 & 29
This is a summary of the final two runs for this stage of the tests on the flexible side coax. For information on the previous flexible side coax runs, see the Summary of Flexible Side Coax Tests with TexCal Cable : Runs 24, 25, & 27 or the individual run summaries.
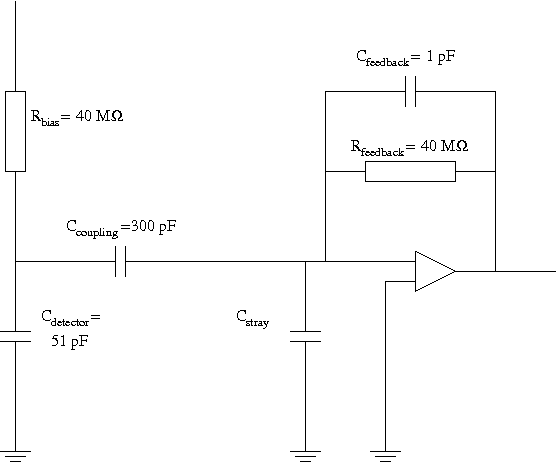
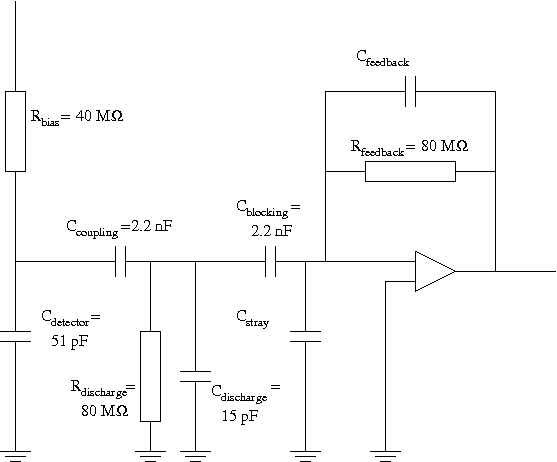
Runs 27 & 29 both utilized a modified version of the standard ionization readout circuit. Figure 1 pictures both the normal readout circuit used in the vacuum side coax and the modified circuit used in versions 3 and 4 of the flexible side coax. The changes to the circuit design included: 80 MΩ feedback resistor on SCUHBA; 80Ω discharge resistor for cable on SCAB; 2.2 nF coupling capacitor on SCAB; and 2.2 nF blocking capacitor on SCUHBA. For a detailed description of the changes made to the circuit, see the Run 27 Summary.
| Figure 1: Circuit Diagram for Vacuum Side Coax (left) and Flexible Side Coax v3 & v4 (right). | |
|---|---|
 |  |
Both versions of the flexible side coax used SMDs instead of the wirebonded components used in the vacuum side coax.
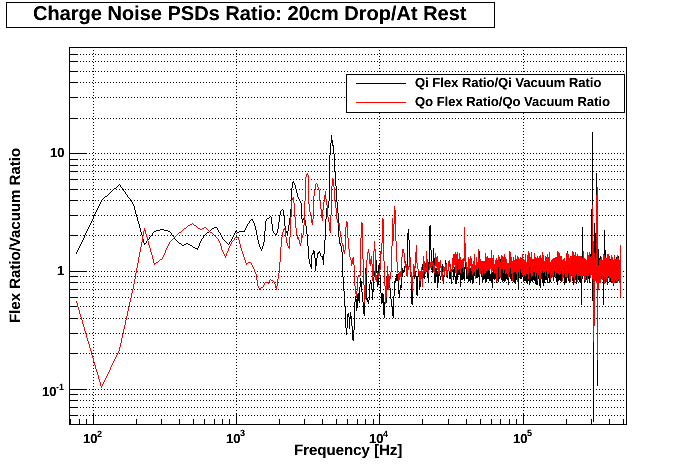
Fig. 3 & 6 below are ratios between the flexible and vacuum side coaxes '20 cm Drop Test'/'At Rest' PSDs. In other words:
- Take 20 cm Drop Test PSD for each channel (Qi & Qo flexible, and Qi & Qo vacuum).
- Take At Rest PSD for each of the aforementioned channels.
- Divide 20 cm Drop Test PSD by At Rest PSD for the aforementioned channels. This will yield one single plot for each of the aforementioned channels.
- Divide the resultant plot for Qi flexible by that for Qi vacuum. Do the same for Qo flexible and vacuum.
Run 27
The SCAB and SCUHBA were connected with six TexCal low noise copper coaxial cables (part no.: 250-3820-0000).
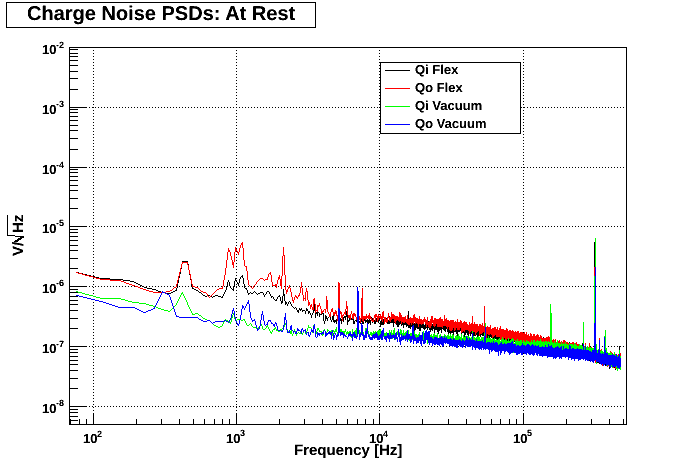
The flexible side coax experiences significantly higher noise at rest for low frequencies than the vacuum side coax, as seen in Fig. 2. However, the ratios of noise profiles in Fig. 3 are similar between side coaxes. Therefore, despite the higher noise level exhibited by this flexible side coax, the response to induced microphonics was similar to the vacuum side coax.
| Figure 2: DCRC32 attached to both side coaxes. |
|---|
 |
| Figure 3: Flexible/Vacuum Side Coax PSD Ratios for Run 27. |
|---|
 |
If one could determine why elevated noise levels are witnessed at low frequency (Fig. 2), this model of the flexible side coax may be the direction we should pursue.
Part of the increase can be explained through an increase in charge gains, as measured in Table 1. Additionally, the input capacitance of the circuit has increased due to the presence of two 2.2 nF capacitors in series with the detector. This would result in a slight increase in noise. Finally, upon disassembly, the braid on the SCUHBA side of the cable was barely in contact with the tower/spool. This would imply that there may have been grounding problems, which may explain the peaks at low frequency. The reason the braid was not in contact with the tower/spool was due to the slightly larger SCUHBA (length 543 mils as opposed to 375 mils), meaning that the cable sat a little higher, and thus was inconveniently placed to ensure the braid came into contact with the tower/spool.
| Table 1: Charge Gain Measurements. | ||
|---|---|---|
| Channel | Gain | Gain/4* |
| Qi vacuum | 512.8 | 128.2 |
| Qo vacuum | 472.2 | 118.1 |
| Qi flexible | 582.0 | 145.5 |
| Qo flexible | 615.6 | 153.9 |
| * Factor of 4 from amplifier on DCRC. | ||
Run 29
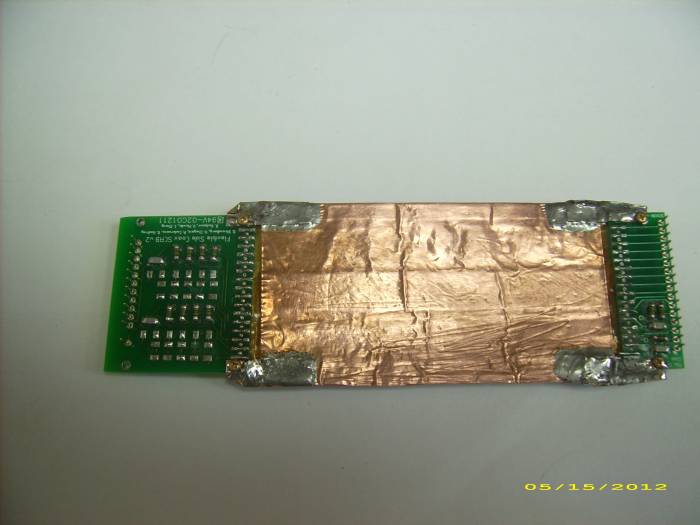
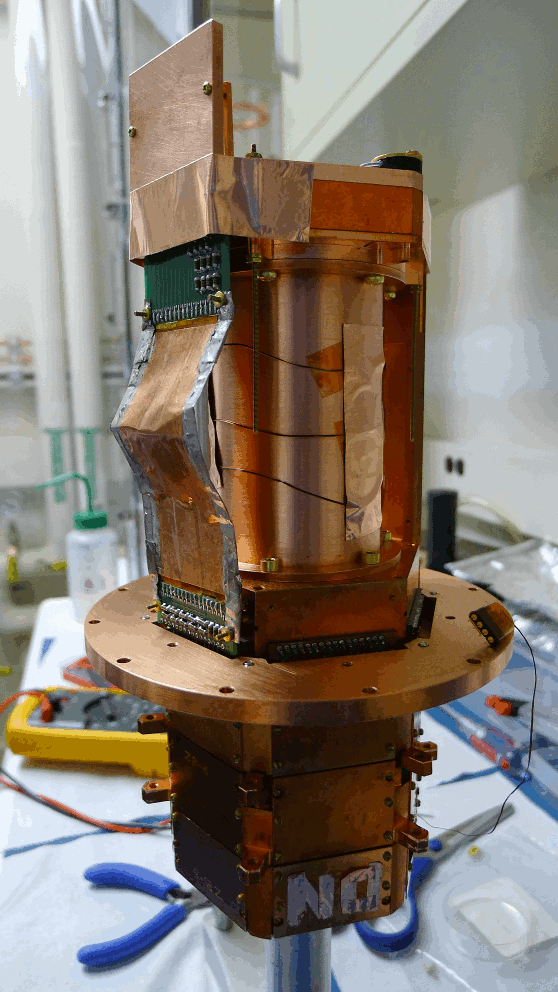
The SCAB and SCUHBA were this time connected using a custom cable made with Kapton and conductive adhesive. Figure 4 pictures the assembled flexible side coax v4 and the assembled tower.
| Figure 4: Flexible Side Coax v4 and the assembled tower for Run 29 | |
|---|---|
 |  |
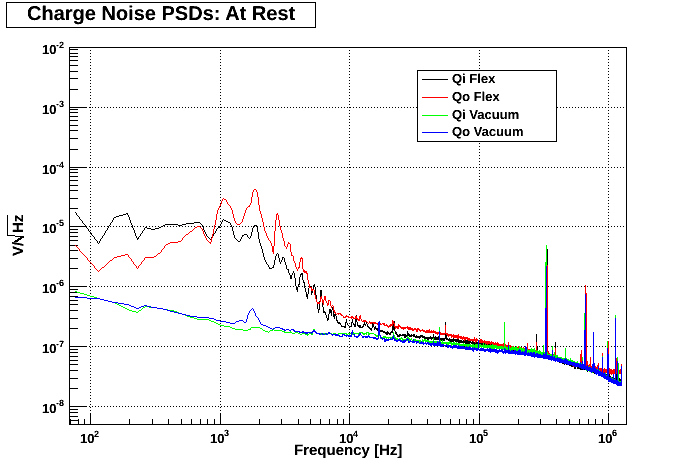
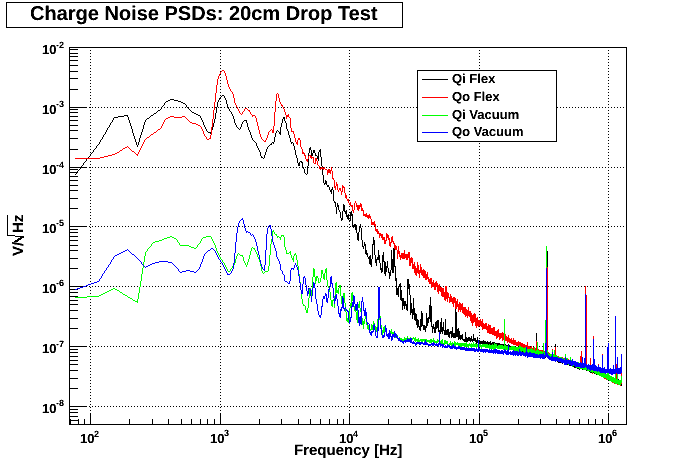
PSD data was taken for all four configurations of the DCRC boards and side coaxes for both At Rest and 20cm Drop Tests. Figure 5 shows some representative PSDs, and Figure 6 shows a plot of the ratios of the noise profiles.
| Figure 5: DCRC33 attached to both side coaxes. | |
|---|---|
 |  |
| Figure 6: DCRC33 attached to both side coaxes. |
|---|
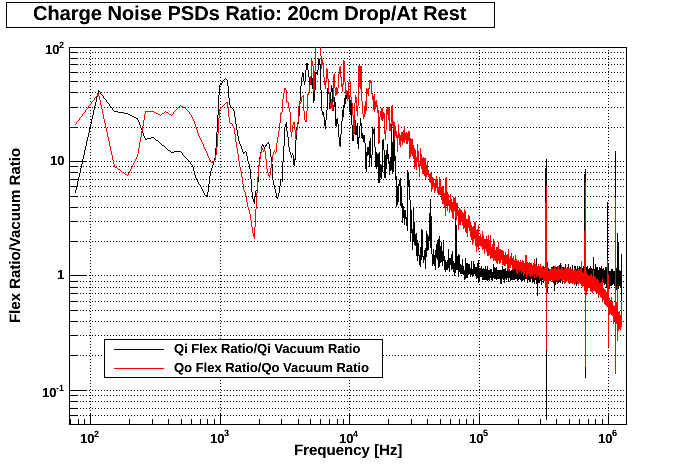 |
Even at rest the ionization channels on the flexible side coax exhibit higher noise profiles than their vacuum counterparts for most frequencies below 100kHz. Looking at Figure 6, it's also clear that the channels on the flexible side coax experience a larger response to induced microphonics. So overall, the Flexible Side Coax v4 is more susceptible to microphonics than the Vacuum Side Coax. The reason for this high noise profile is perhaps due to the fact that at low temperatures, the conductive adhesive used in the cable for this design no longer conducts. Plans for redesigning the cable by perhaps painting the wires with graphite are being discussed.
Also during this run, an Evercool EC2510M12CA computer fan (http://www.evercool.com.tw/categories/global/fan/dcfan/ec-2510/ec2510.php) was placed near the needle valve of the fridge in an attempt to induce mechanical vibrations. The fan was powered with a 9V battery with no resistor in series.
PSD data was taken for each ionization channel for each of the following configurations:
- At Rest: The fan was turned off
- Fan - No Contact: The fan was on, but not in direct contact with the needle valve.
- Fan - No Contact - Foil: Same as “Fan - No Contact”, but the battery was wrapped in aluminum foil and placed farther away from the setup.
- Fan - Contact - Foil: The fan was on, in contact with the needle valve, and was powered with the aluminum-foil-wrapped, 9V battery.
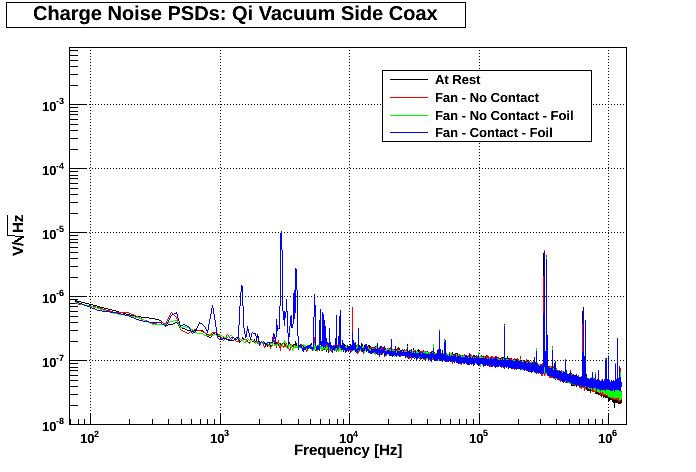
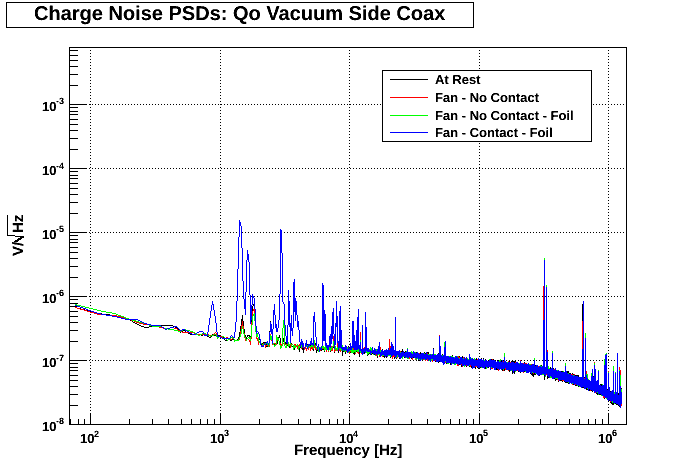
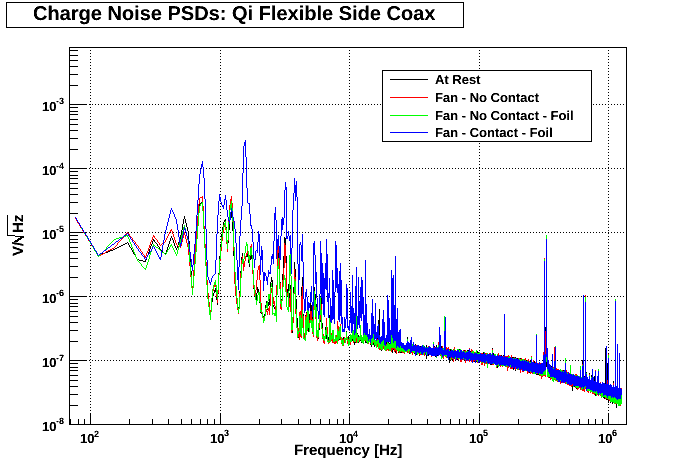
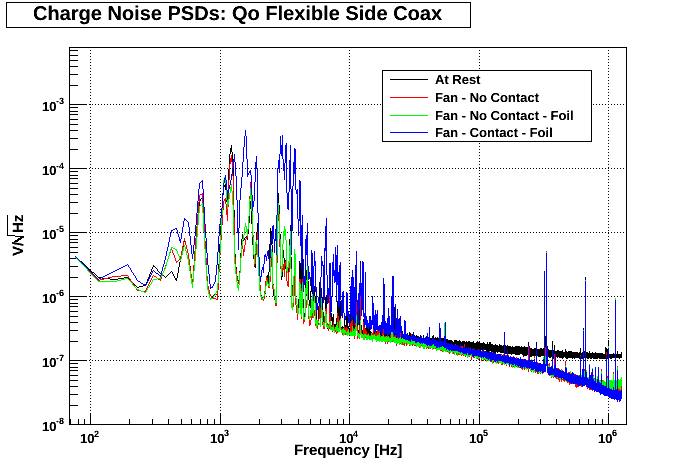
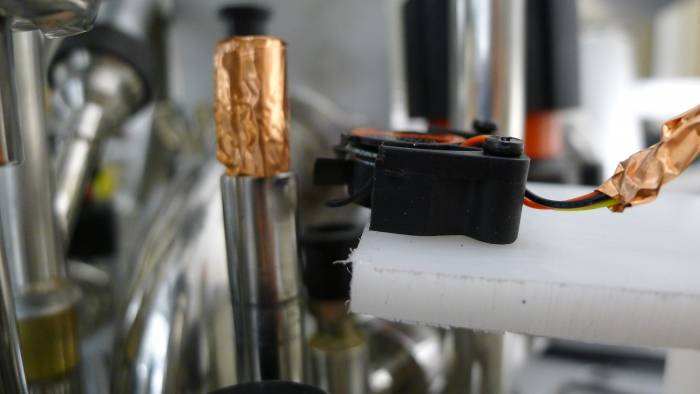
Figure 7 shows the PSD data taken using this fan setup while DCRC32 and DCRC33 were connected to the vacuum and flexible side coaxes respectively. Figure 8 shows pictures of the fan setup on top of the fridge.
| Figure 7: Fan Data: DCRC32 attached to Vacuum Side Coax; DCRC33 attached to Flexible Side Coax. | |
|---|---|
 |  |
 |  |
| Figure 8: Pictures of the fan setup. | |
|---|---|
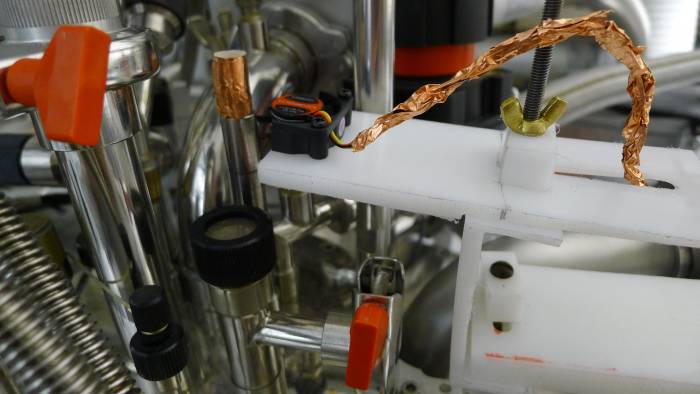 |  |
Looking at the PSDs in Figure 7, both side coaxes experienced higher noise profiles when the fan was actually in contact with the needle valve. In addition, the fact that this higher noise wasn't visible when the fan was not in contact with the needle valve indicates that the increase in noise was not due to electrical coupling. As such, this setup could be used in the future as a consistent method for inducing mechanical vibrations.
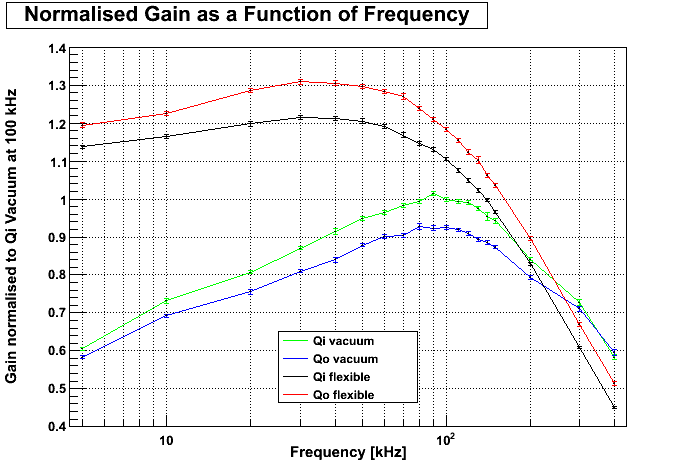
For this run, we again took charge gain measurements by sending sine waves down the QET return lines and measuring the output with the DCRC boards. For this run, we took charge gain measurements using sine waves of various frequencies to see how gain depended on frequency. Figure 9 shows a plot of the charge gains vs. frequency for each ionization channel normalized to the 100kHz point for Qi Vacuum.
| Figure 9: Normalized Charge Gain Measurements. |
|---|
 |
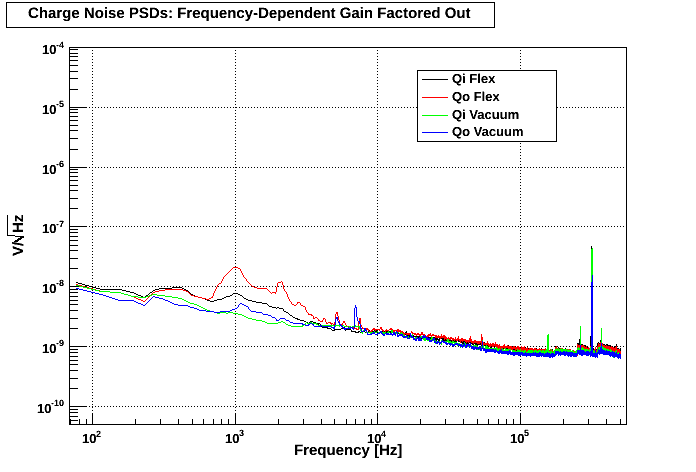
Figures 10 & 11 show the averaged at rest PSDs from Figures 2 & 5, respectively, after factoring out the frequency-dependent gain.
| Figure 10: PSD from Run 27 with gain factored out: DCRC32 attached to both side coaxes. |
|---|
 |
| Figure 11: PSD from Run 29 with gain factored out: DCRC33 attached to both side coaxes. |
|---|
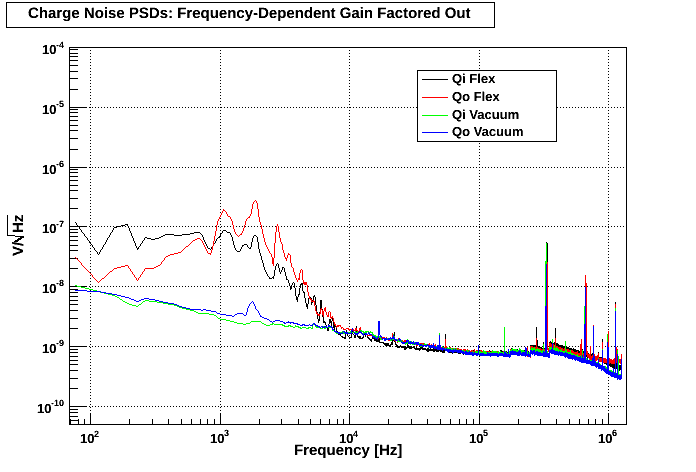 |
Factoring out the gain does somewhat reduce the differences in noise profiles seen between flexible and vacuum side coaxes, but for the PSD from Run 29, there is still a significant amount of noise (especially below 10kHz) that can not be attributed to differences in gain.