Table of Contents
Run 27
Summary
Description of Setup
| Table 1: Run 27 Setup. | ||
|---|---|---|
| Detector | 51 pF mica capacitor | |
| Tower | T1 | |
| Face | 5 | 2 |
| Side coax | ZB1-1-9 | Flexible v3.1 |
| SQUET | ZC70 | ZC23 |
| Stripline | #20 | #19 |
| Readout | DCRCv3 | |
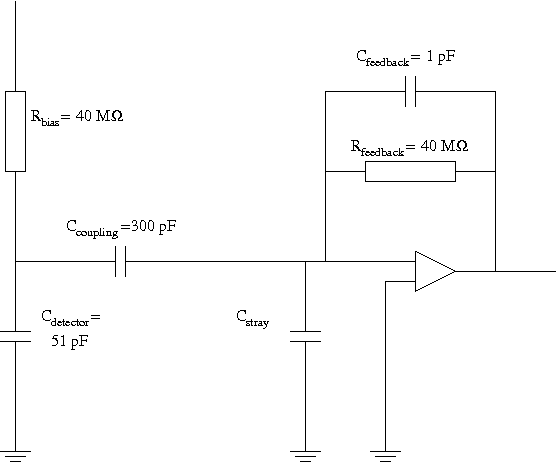
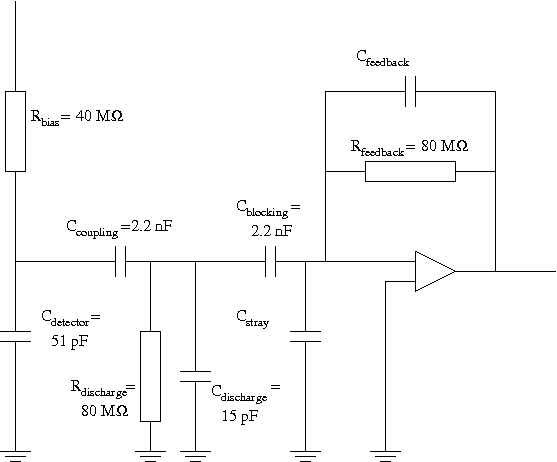
| Figure 1: Circuit Diagram for Vacuum Side Coax (left) and Flexible Side Coax v3.1 (right). | |
|---|---|
 |  |
The experimental setup is similar to that of Run 24. Unlike Run 25 where each wire-bonded component was replaced with Surface Mounted Devices (SMDs), some additional modifications to the flexible side coax's circuit have been made following Gary's suggestions. The following is brief summary, paraphrased from Gary's email:
Gary pointed out that the present Soudan design allows for a DC voltage to remain on the cable. The output of the preamp is maintained at 0 V by the feedback to the FET source. However, there is still a non-zero voltage on the side of the FET that is connected to the coaxial cable. This makes the cable a microphone. To combat this, one can modify the circuit diagram to incorporate the following changes:
- Add a blocking capacitor on the gate at the SCUHBA end. To ensure that the series combination of the two blocking capacitors on the gate at both the SCAB and SCUHBA ends is around 1 nF, we have replaced the 300 pF mica capacitor we used last run with two 2.2 nF ceramic NP0 capacitors. It is difficult to find mica capacitors that have such a high capacitance, and from the paper Richard sent round earlier, it appears that ceramic NP0 capacitors do not change too much at cryogenic temperatures. The series combination of 1.1 nF is higher than that of the detector and cable.
- Add 80 MΩ resistor between gate cable and ground on SCAB to keep cable discharged. Of course this resistor chain lies before the blocking capacitor (ie. is connected directly to the cable).
- As discharge and feedback resistances are in parallel for noise calculations, increase feedback resistance to 80 MΩ. This makes a parallel combination of 40 MΩ.
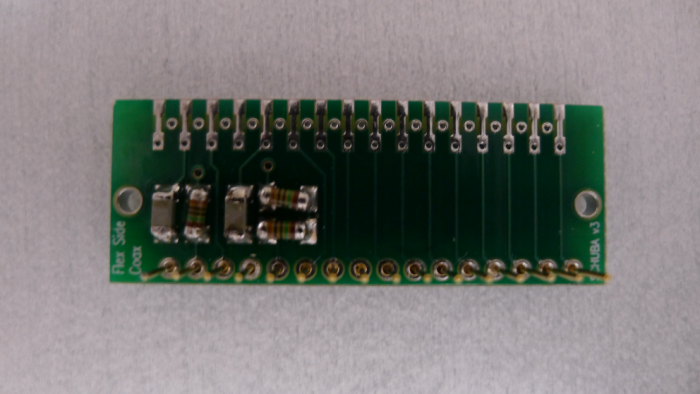
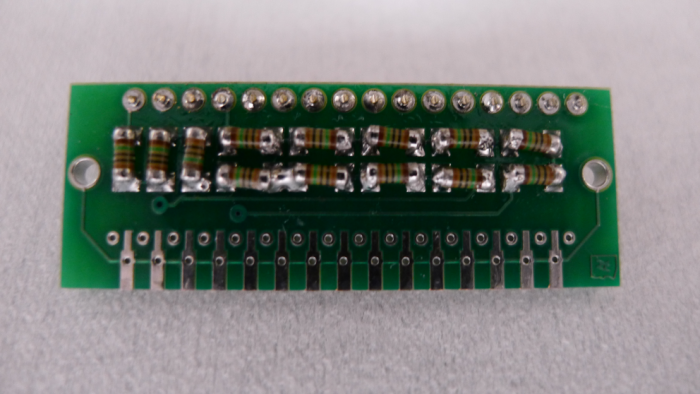
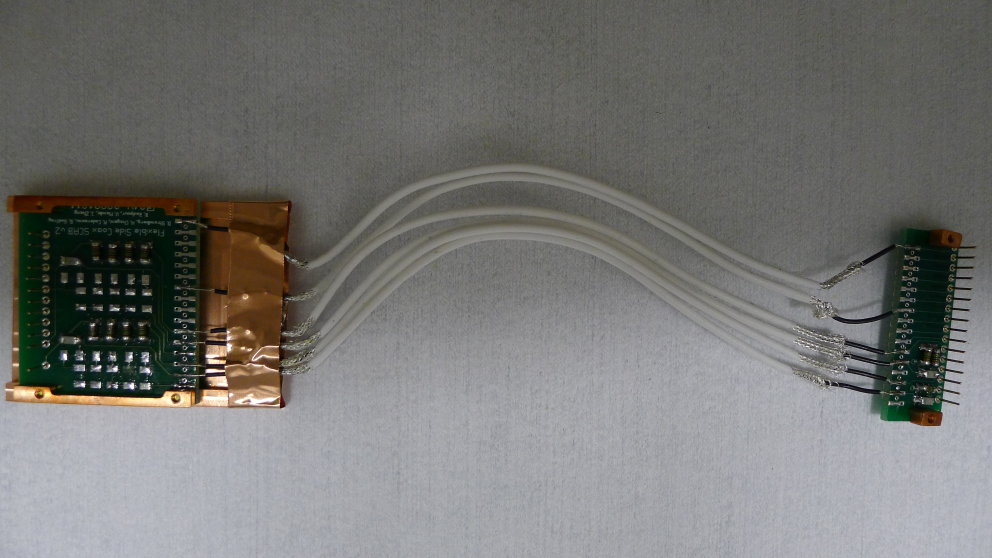
Diagrams of the current and new circuits are shown in Fig. 1. Photographs of the SCUBA board and assembled side coax are shown in Fig. 2. Gerber files for the SCAB and SCUHBA are available beneath Fig. 2, together with data sheets for the electronic components. An error in the design of SCUHBA v3 is visible on the Solder side: there is a missing trace between two resistors. This has been rectified with a solder joint, as shown in Fig. 2 (top-right). The feedback resistors previously located on the SCAB have been desoldered and moved to the SCUHBA. As the feedback resistors are located on the SCUHBA, six (rather than 8) low noise copper coaxial cables bridge gap between SCAB and SCUHBA.
| Figure 2: Flexible Side Coax SCUHBA v3 Component (top-left) & Solder (top-right) Sides; and Assembled Flexible Side Coax v3.1 (bottom) | |
|---|---|
 |  |
 |
|
Gerber files: SCAB & SCUHBA
Data sheets: 2.2 nF CoG/NP0 capacitor AVX 12065A222FAT2A & 10 MΩ metal film resistor Vishay Beyschlag MMA02040C1005FB300.
| Table 2: Tower Level Continuity Checks. | ||
|---|---|---|
| Side Coax | ZB1-1-9 | Flexible v3.1 |
| Tower Face | 5 | 2 |
| Qi feedback - Qi gate | 26 nS | 13 nS |
| Qi gate - Qi bias | <0.2 nS | <0.2 nS |
| Qi gate - ground | - | <0.3 nS |
| Qi bias - QET return D | <0.2 nS | <0.2 nS |
| Qi bias - ground | - | <0.3 nS |
| Qo feedback - Qo gate | 25 nS | 13 nS |
| Qo gate - Qo bias | <0.2 nS | <0.2 nS |
| Qo gate - ground | - | <0.1 nS |
| Qo bias - QET return D | <0.2 nS | <0.1 nS |
| Qo bias - ground | - | <0.1 nS |
| No shorts to ground! | ||
Charge Noise Measurements
As with previous runs, PSDs were taken with the DetectorReadout vi using waveforms of trace length 26.2144 ms, and four different DCRC configurations were used:
- DCRC32 attached to flexible side coax, DCRC33 connected to vacuum side coax.
- DCRC33 attached to flexible side coax, DCRC32 connected to vacuum side coax.
- DCRC32 connected to both side coaxes.
- DCRC33 connected to both side coaxes.
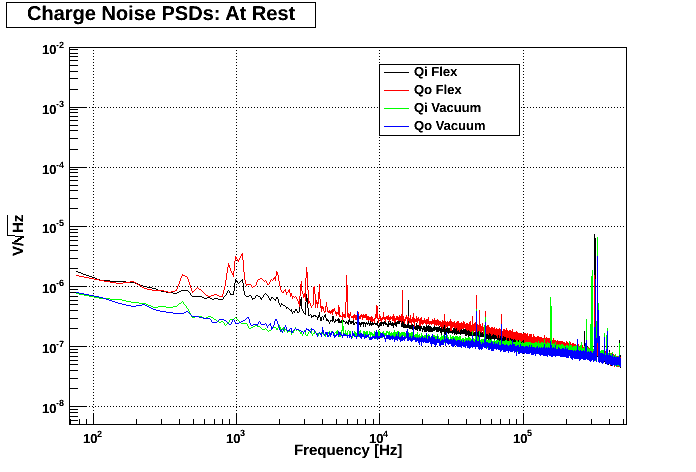
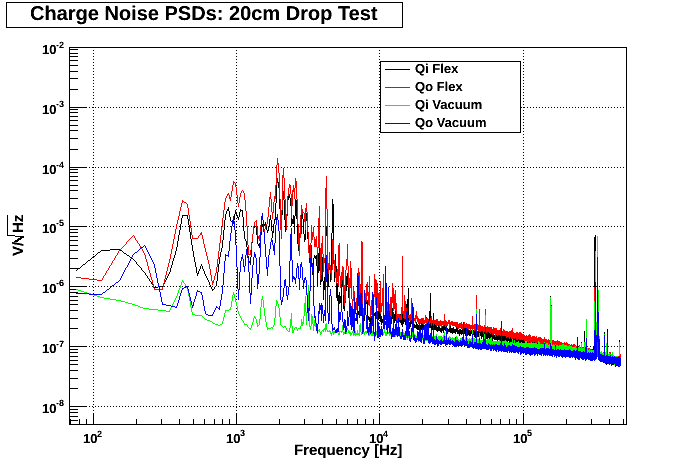
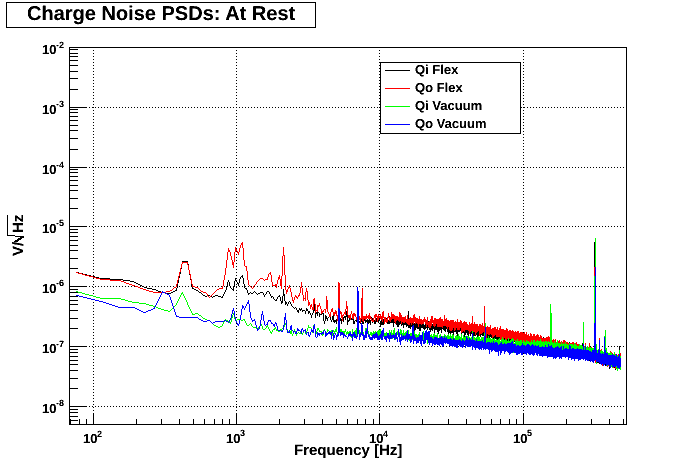
Complete sets of PSDs can be found on Run Diary Page: 2012/04/23. As with previous runs, data was taken at rest and when a mass was dropped from 20 cm above the fridge frame. Sample PSDs are shown in Fig. 3 & 4.
| Figure 3: DCRC32 attached to Flexible Side Coax; DCRC33 attached to Vacuum Side Coax. | |
|---|---|
 |  |
| Figure 4: DCRC32 attached to both side coaxes. | |
|---|---|
 | 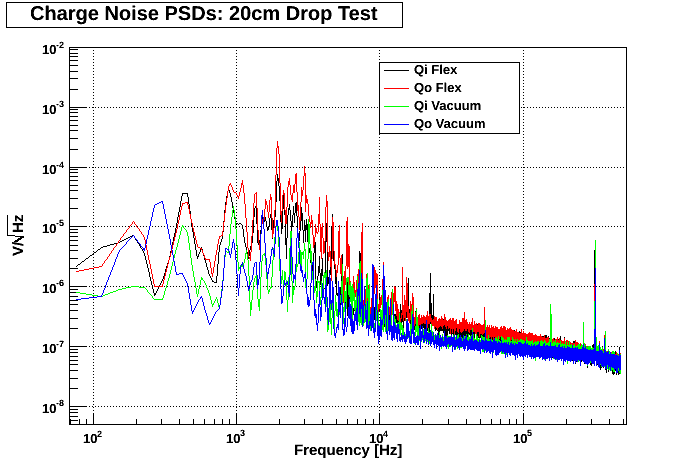 |
The first thing to note is the elevated noise levels in signals from the flexible side coax when looking at the PSDs taken at rest. As the circuits are different, this may be explained by a change in gain (please see below for a discussion). Additionally, there are peaks present in the PSDs from the flexible side coax in the low energy region (<4 kHz), which are not seen in signals from the vacuum side coax. Could one possibility lie in noise generated by the components themselves? During Run 25, 300 pF mica capacitors were tested. This is the first time we have used the ceramic NP0 capacitor. Could these components be adding noise to the circuit?
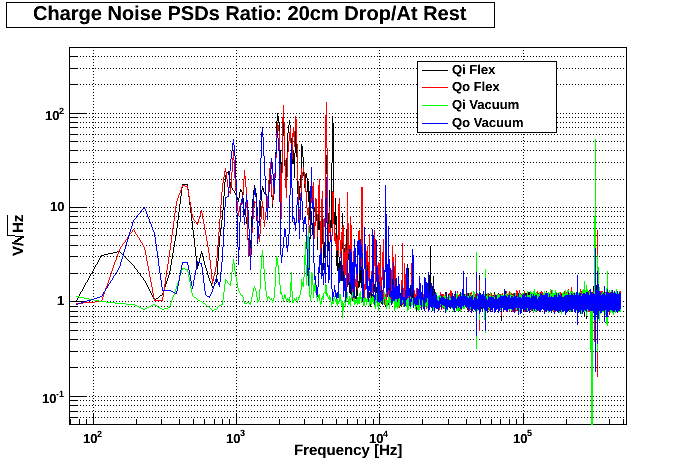
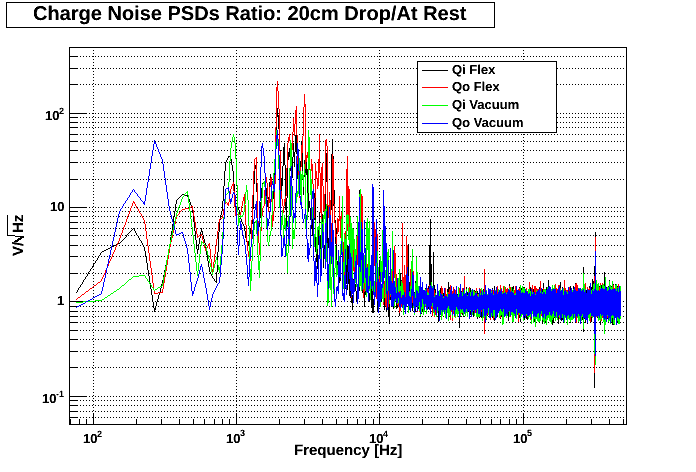
Some discussion of the merits of the 20 cm drop test should be made. Firstly, a quick comparison between Qi vacuum at rest in Fig. 3 indicates that the microphonics induced by this action have little effect on this signal. However, Fig. 4 indicates a much larger effect, highlighting the qualitative nature of this test. Previous runs have shown that there is little difference between the PSDs recorded under different DCRC configurations. Indeed, comparing the “at rest” PSDs in Fig. 3 & 4, one can see that although there are some differences, these are relatively small.
Additionally, does dropping a mass from a set height actually induce microphonics in the side coax cable itself? One perplexing observation made in previous runs is that the vacuum side coax appears to be just as susceptible to microphonics as the flexible side coax. This is a little difficult to explain, as there is nothing for the vacuum side coax to actually rub against when disturbed. Is it possible that by dropping the mass onto the fridge frame, one is actually inducing microphonics elsewhere in the circuit? For example, the D-50 connectors, stripline, etc.
For the time being, if we are to assume that the 20 cm drop test does indeed induce microphonics in the side coax itself, the ratio between 20 cm drop test and at rest PSDs can be plotted as shown in Fig. 5. These plots indicate that even with a higher “at rest” noise in the flexible side coax, the responses of both side coaxes are comparable.
| Figure 5: Ratios of 20 cm Drop Test to At Rest PSDs: DCRC32 connected to flexible side coax, DCRC33 connected to vacuum side coax (left); and DCRC32 connected to both side coaxes (right). | |
|---|---|
 |  |
Charge Gain Measurements
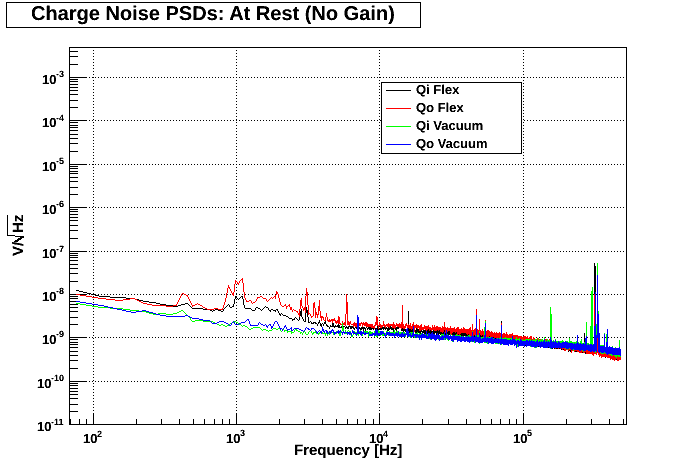
As shown above, signals from Qi and Qo on the flexible side coax are a factor of 2 noisier than their vacuum side coax counterparts. Changes made to the flexible side coax circuit may result in a higher charge gain. This could provide an explanation for the increased noise.
Charge gains have been measured previously during Run 24 to estimate the capacitance of the fake detector. Measurements were performed in a similar fashion. A 1 mV peak-to-peak sine wave of frequency 100 kHz was sent down the QET Return lines and the output was monitored with the DetectorReadout vi. The determined charge gains are shown in Table 3. The error in the gain is negligible.
| Table 3: Charge Gain Measurements. | ||
|---|---|---|
| Channel | Gain | Gain/4 |
| Qi vacuum | 512.8 | 128.2 |
| Qo vacuum | 472.2 | 118.1 |
| Qi flexible | 582.0 | 145.5 |
| Qo flexible | 615.6 | 153.9 |
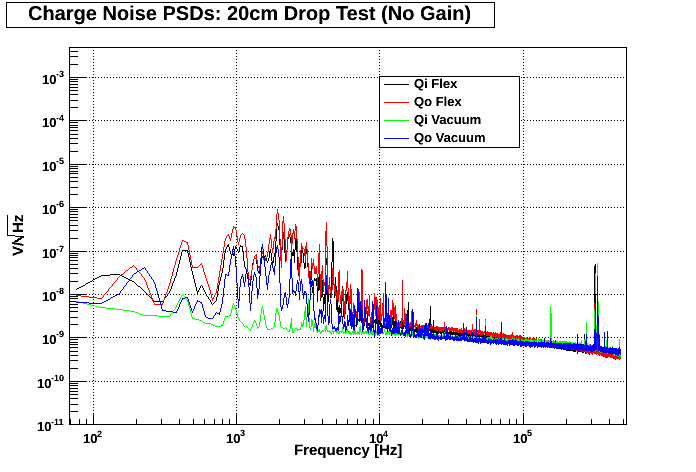
Although the flexible side coax circuit does result in a higher gain than that of its vacuum side coax counterpart, the ratio is not enough to explain the higher noise that is witnessed in Qi & Qo flexible. Figure 6 shows the PSDs for one of the aforementioned DCRC configurations with the gains in Table 3 factored out.
| Figure 6: PSDs with Charge Gains from Table 3 factored out; DCRC32 connected to flexible side coax, DCRC33 attached to vacuum side coax. | |
|---|---|
 |  |
Attempting to Induce Microphonics with Loudspeaker
During this run, an attempt was made to induce microphonics with a loudspeaker mounted on top of the fridge frame as shown in Fig. 7. A square wave of amplitude 10 V peak-to-peak drove the loudspeaker. PSDs were taken at frequencies of 5, 10, 20, 50 & 100 kHz, and complete sets are shown here (Run Diary Page: 2012/04/23).
| Figure 7: Top and Side views of speaker mounted to fridge frame. | |
|---|---|
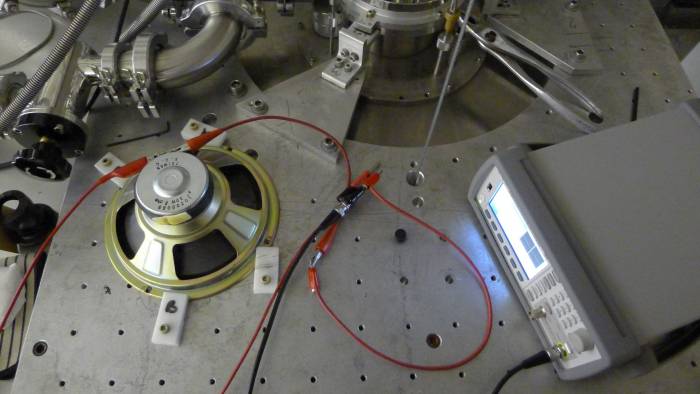 | 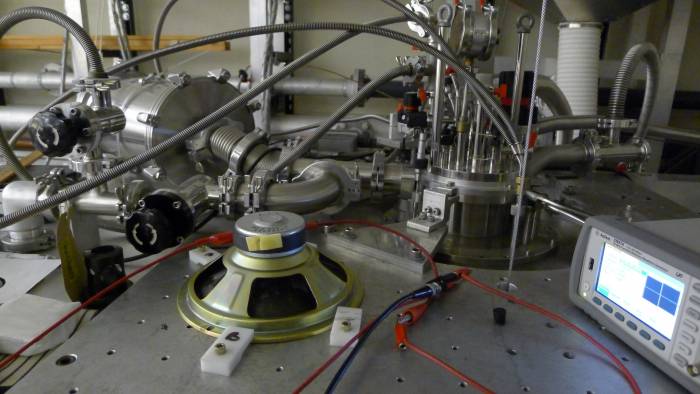 |
Unfortunately, lifting the speaker off the frame yielded similar PSDs, indicating that the peaks are due to electrical coupling of the signal to the charge amplifier circuit rather than mechanical excitation of the fridge. Moving the speaker further from the DCRC boards (to the position of the function generator in Fig. 7) did result in the disappearance of harmonics and reduction in primary peak intensity. However, lifting the speaker off the frame did not cause the primary peak to disappear. Twisting the wires connected to the speaker had no effect.