Table of Contents
Run 14
Summary
Neutralisation is lost after an hour under bias, when Side 1 is negatively biased at -2.5 V. Reversing the bias causes a significant degradation after approximately 5 minutes.
Tower temperature was a little high at 69 mK this run, which meant that Side 1's phonon channels were in their transition region. However, once the temperature dropped to 67 mK, no unusual response was witnessed in any of the phonon channels.
Triggering on Qi only yielded a higher number of Qo events. The reasons for this are unknown.
Setup
| Table 1: Run 14 setup | ||
|---|---|---|
| Detector | G19N | |
| Tower | T1 | |
| DIB | 1 | 2 |
| Face | 5 | 2 |
| Side coax | ZB1-1-9 | ZB1-1-6 |
| SQUET | ZC23 | ZC70 |
| Stripline | #20 | #19 |
| Readout | DCRCv3 | |
Tower level continuity checks can be found here (run diary: 2011/06/29).
There are two Am-241 sources above side 2 (ie. side with DIB2 Qi & Qo channels), installed within the 3“ source holder we use for oZIPs. One source lies in the centre of a phonon channel. The other lies to the side of another phonon channel, just within its boundaries.
Regarding neutron shielding, the polyethylene cylinder of diameter 4” and height 1.5“ was not placed in the IVC prior to tower installation. However, the nine 1” diameter polyethylene sheets were still in place above the IVC. Please see Run 12 Summary for more details.
DAQ Issues
Due its success in Run 12, the old DAQ was used, and hence all data was recorded in oZIP format (DIB1 acting as zip1). When taking short trace length data (0.4096 ms) while triggering on the phonon channels, the data acquisition rate slowed down significantly (28 Hz to 2 Hz) for extended periods of time. It is unknown whether this is a problem with the software or DCRC boards.
Cryogenic Issues
The base temperature was rather high at 69 mK. At first this was thought to be due to insufficient evacuation of He-4 exchange gas from the IVC before the mixture was condensed. The fridge was warmed up to 13 K, and the IVC was pumped on overnight in an attempt to remove any remaining exchange gas. It had some effect, reducing the base temperature from 75 mK to 69 mK.
It is unknown why the base temperature has remained so high. Measurements in Little Blue (iZIP detector elog entry 355) indicate that Side 1's Tcs lie in this temperature region, implying that it will be difficult to tune the SQUIDs. Side 2's Tcs are around 20 mK higher.
Charge Stability Measurements
Short trace length : Trigger on charge channels : Side 1 negatively biased
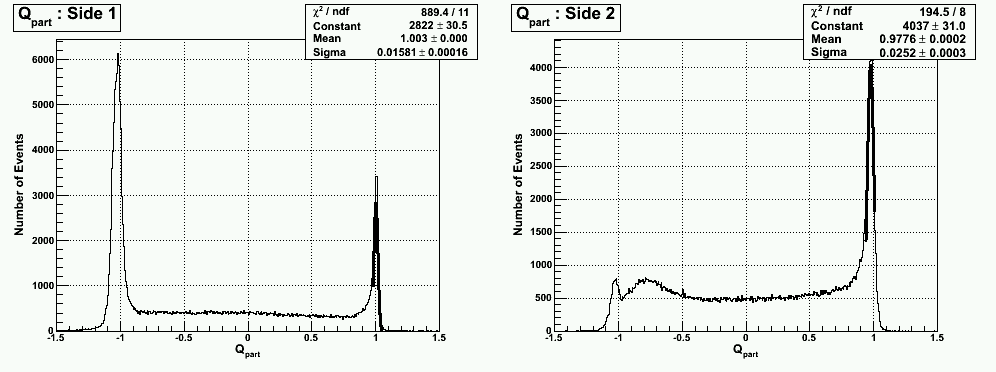
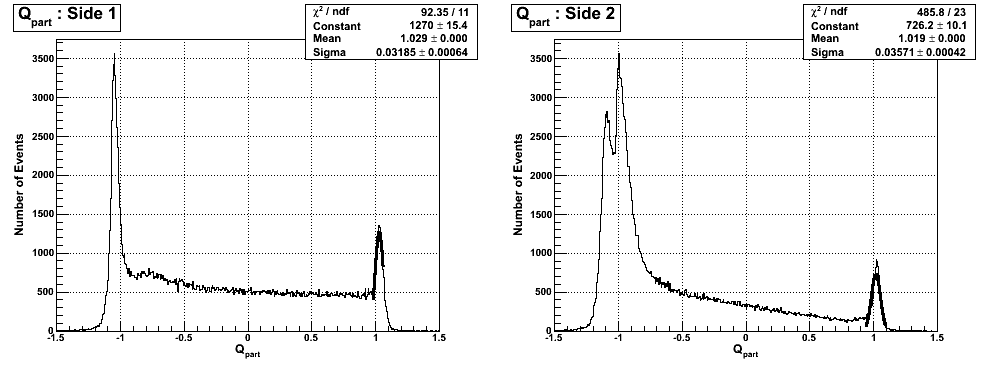
Although the DAQ was set to trigger on Qi only, the Side 1's Qo peak in Fig. 1 is significantly larger than that of Qi. The DAQ code itself has not changed between runs, and as we have not seen this behaviour during K100 Run 12 (G42), it is unlikely that the DAQ is to blame. Although Side 2's Qpart plot looks reasonable, there is a strange double peak feature near Qpart = -1.
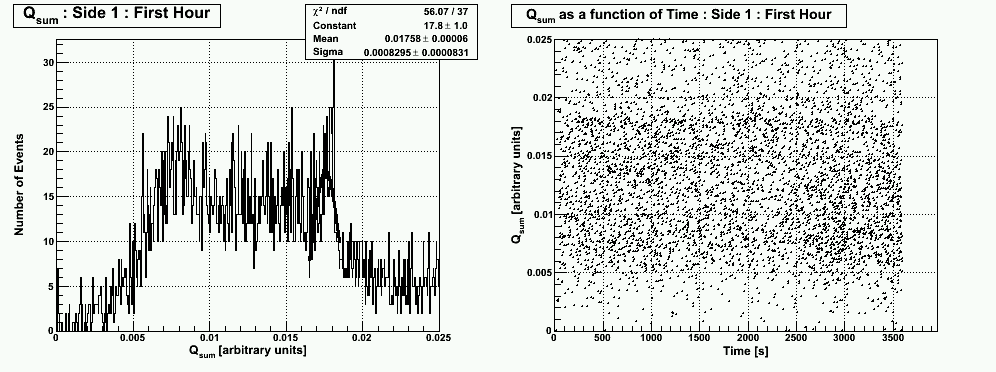
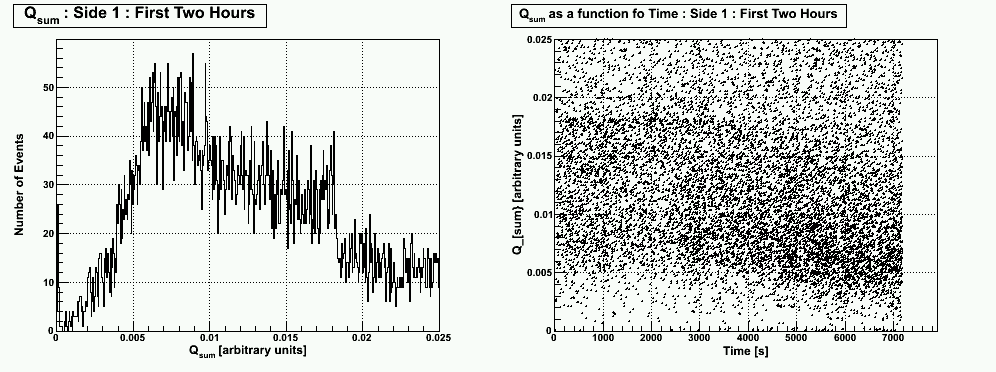
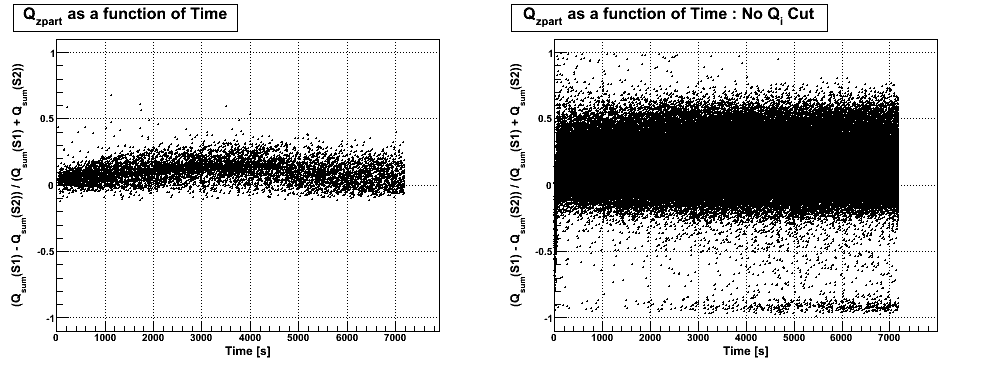
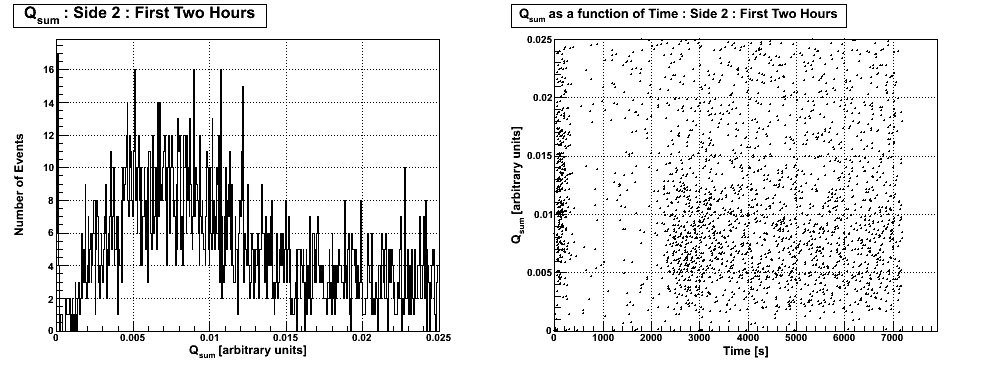
The Qsum vs. time plot in Fig. 2 indicates that neutralisation degrades after an hour. The Qzpart vs. time plot in Fig. 3 features a bump at around this time if the Qi cut is implemented.
| Figure 1: Qpart from data series 07110707_0528. |
|---|
 |
| Figure 2: Qsum & Qsum as a function of time from data series 07110707_0528. |
|---|
 |
 |
| Figure 3: Qzpart as a function of time from data series 07110707_0528. |
|---|
 |
Short trace length : Trigger on charge channels : Side 1 positively biased
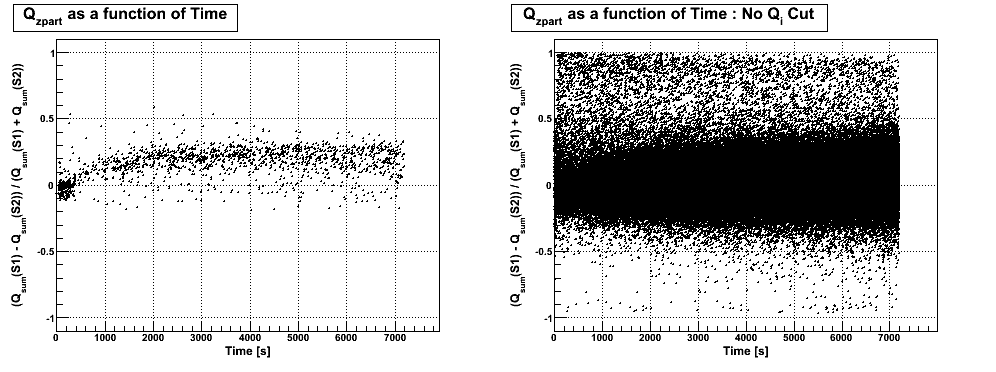
Flipping the bias seems to make the situation worse. In Fig. 4, more events are present in the Qo peak on both sides, and the double peak feature is still seen on Side 2. Additionally, Fig. 6 indicates that there is a degradation in neutralisation after approximately 5 minutes under bias.
| Figure 4: Qpart from data series 07110708_0622. |
|---|
 |
| Figure 5: Qsum & Qsum as a function of time from data series 07110708_0622. |
|---|
 |
| Figure 6: Qzpart as a function of time from data series 07110708_0622. |
|---|
 |
Short trace length : Trigger on phonon channels : Side 1 negatively biased
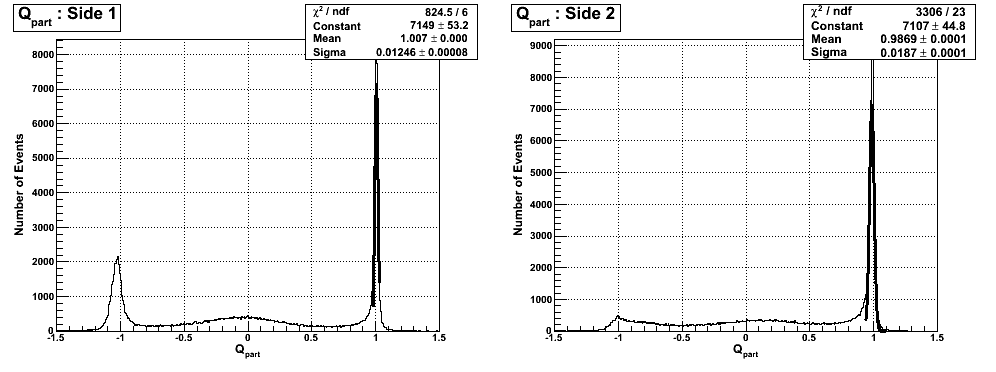
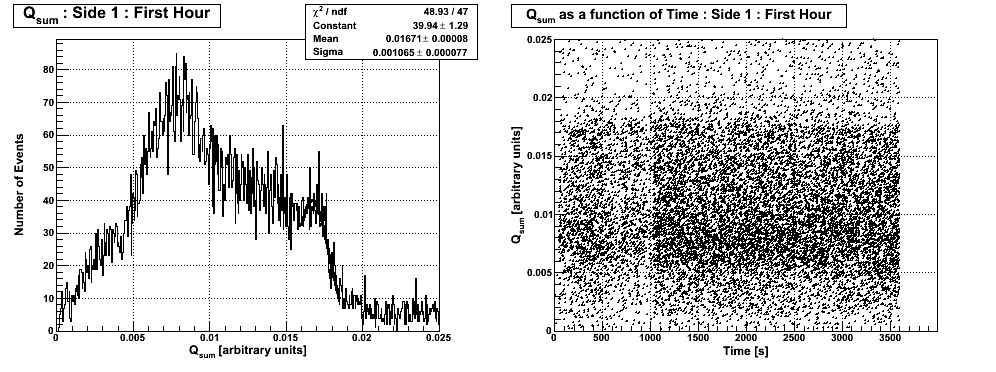
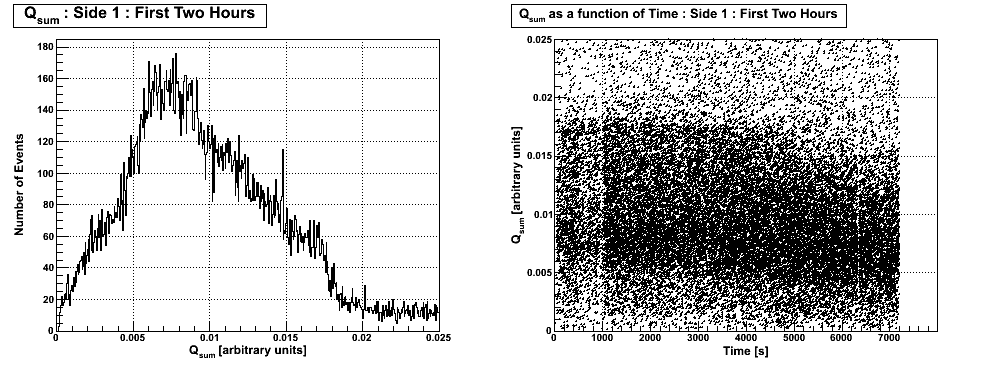
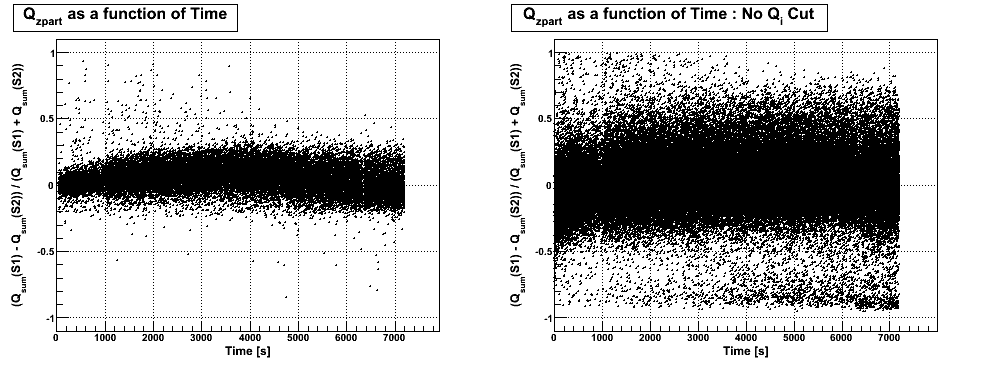
Triggering on the phonon channels returns expected Qpart plots, shown in Fig. 7. Neutralisation degrades after an hour (Fig. 8), and the bump in the Qzpart vs. time plot in Fig. 9 is still seen.
| Figure 7: Qpart from data series 07110710_1201. |
|---|
 |
| Figure 8: Qsum & Qsum as a function of time from data series 07110710_1201. |
|---|
 |
 |
| Figure 9: Qzpart as a function of time from data series 07110710_1201. |
|---|
 |
Long trace length : Trigger on phonon channels : Side 1 negatively biased
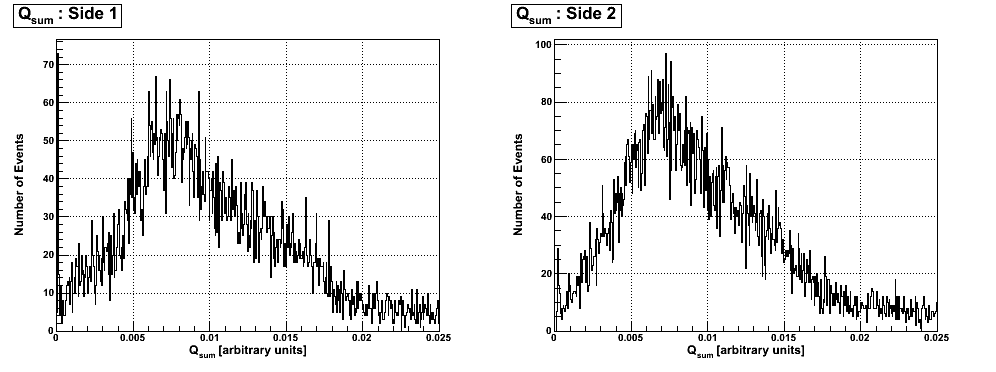
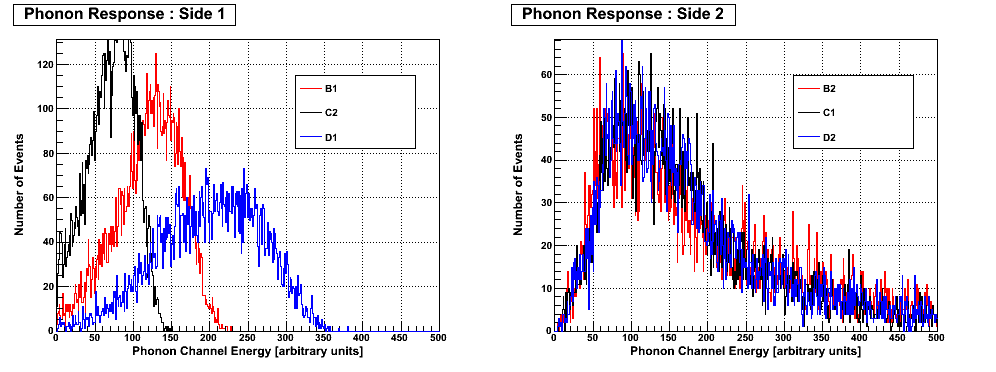
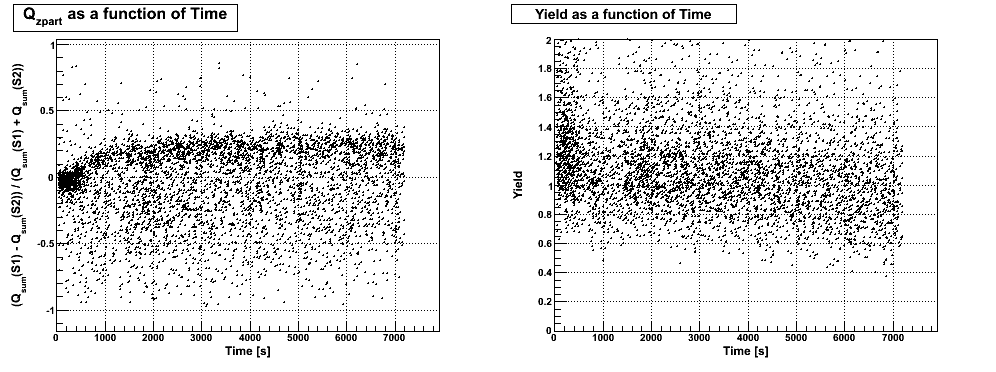
Tower temperature was 69 mK. With reference to Tc measurements in Little Blue (Run 26), this lies close to the average Tc of 68 mK on Side 1 (Side 2's Tc average is 90 mK). As a result, even though all phonon channels were tuned and locked, the responses of Side 1's phonon channels in Fig. 11 seem to indicate that larger pulses sent the the TESs normal. As a result, only Side 2's phonon channels were used to define the yield in Fig. 12.
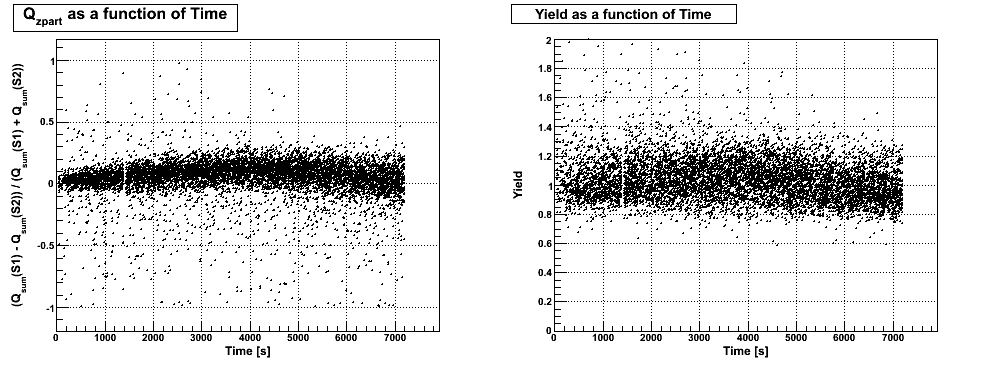
There seems to be a bump in the Qzpart vs. time plot in Fig. 12 after around an hour under bias. The reasons for this are unknown. The yield seems to dip at around 4000 s, which is in good agreement with the results shown above.
| Figure 10: Qsum for Sides 1 & 2 from data series 07110709_0206. |
|---|
 |
| Figure 11: Phonon channels response from data series 07110709_0206. |
|---|
 |
| Figure 12: Qzpart & Yield as a function of time from data series 07110709_0206. |
|---|
 |
Long trace length : Trigger on phonon channels : Side 1 positively biased
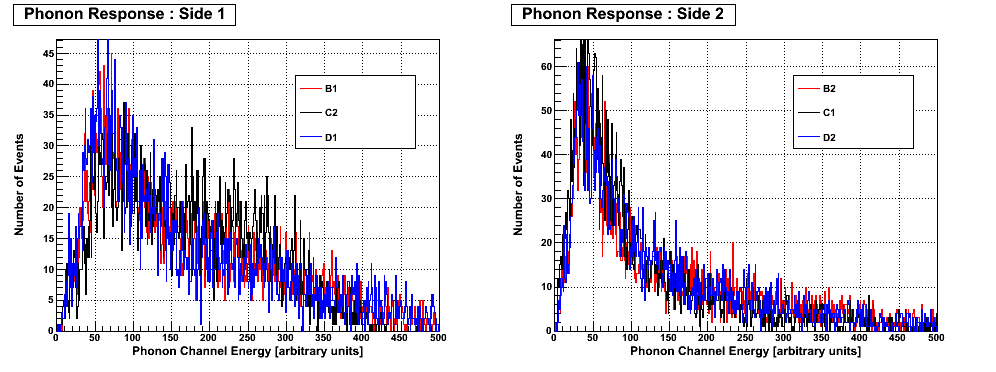
The tower temperature dropped to 67 mK by the time this data was taken. As a result, the phonon responses on Side 1, shown in Fig. 14, indicate that this was cold enough to see complete phonon pulses. Therefore, phonon channels from both sides were used to determine the yield in Fig. 15.
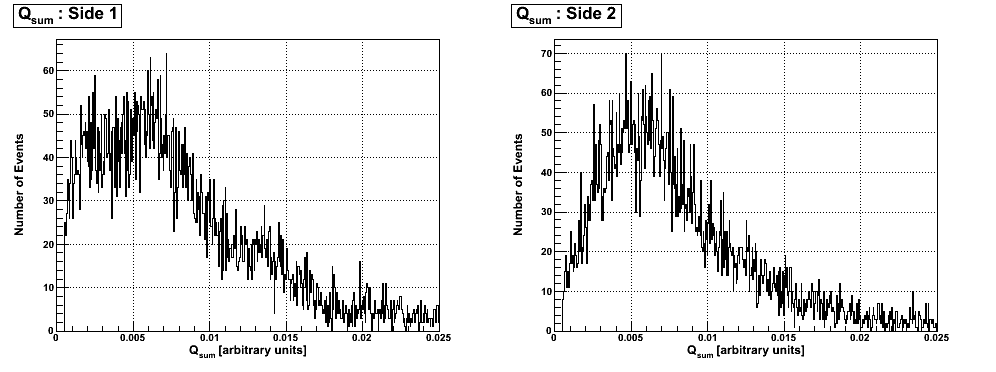
As expected from the aforementioned charge-only results, neutralisation degrades very quickly, after approximately 5 minutes under bias in this configuration. Due to the poor performance of this crystal under reverse bias, it was decided not to investigate the effect of flipping the bias.
| Figure 13: Qsum for Sides 1 & 2 from data series 07110712_0308. |
|---|
 |
| Figure 14: Phonon channels response from data series 07110712_0308. |
|---|
 |
| Figure 15: Qzpart & Yield as a function of time from data series 07110712_0308. |
|---|
 |