2020/07/28 (Tuesday)
- Lab in-person: Zach
- Virtual partner: Matt
| Setup | Run 73. DIB 1/3/4 → Stripline 43/48/41 → pi-filters 1/2/3 → Cable 3/1/2 → nothing/nothing/accessory_interposer → HV_Conn 1/3/2 → HV 1/2 → DCRCX(4)/DCRC55(1)-master; DCRC33(2) → HV control. DCRCs on overnight. Lead/poly shield erected (4 lead walls, 2 poly walls). |
|---|---|
| 0840 | MB = 63.5% |
- Analysis of last night's data, taken after IbIs and resetting the QET biases to lower in transition, shows noise width around 369 eVee, similar to Run72. (350 eVee using a quadratic calibration, this is a better comparison. Similar Run72 data had 328 eVee.)
- analysis of today's 0905 data does not show improved noise (it's a little worse). Gain is slightly (4%) higher.
| 0905 | Check phonon channels with pulse viewer - all look fine. Let's take some more data. |
|---|---|
| 0905 | Start a 60 min series at HV = 0, CDMS detector: Driver Gains = 1x, DCRC4/1 QET biases = (0,320,390,0)/(0,360,420,440) uA, Front-End Gains = (3/3/3)/(5/5/5) 1000 BOR randoms, trigger on DCRC1pD threshold = 8 Use sequence SimpleDataLoopNoFlash.msl |
| 0910 | Tower = 53.6 mK |
| 1230 | Zach Williams body temperature = 98.7 F |
| 1255 | Zach enters lab |
| 1305 | Tower/MC/Coldplate = 53.4/31.1/191 mK, Still = 1.46 K / 0.18 mbar / 5 mW, G1/G2= 386/359 mbar, 1K Pot = 1.65 K / 28±2 mbar. |
| 1240 | MB = 55.9% |
| 1318 | Fill LN2 cold trap bath |
| 1320 | Noticed that the tower temp increased by ~1mK and started fluctuating by about 0.5mK starting at 7am. |
| 1325 | Zach leaves lab |
| 1400 | Zach Williams body temperature = 98.3 F |
From last Friday:
python HVscan.py -iDCRC 2 -HVs 5 -HVcalFile HV_calibrations/HV_DCRC2_control_cals_500V_200721.txt -HVdriftRate 0.031 -HVpreBias 10/2 -tSeries 60 -DCRCs2Flash 3 >> ../../sequencer/HVdrift_5V_31mVps_pre10-2_60min.msl
| 1420 | Build a new sequence for 5-Volt data, with no pre-biasing. According to the sequence code, there should be only a 5 second delay between first applying bias and reaching the 5V initial value. python HVscan.py -iDCRC 2 -HVs 5 -HVcalFile HV_calibrations/HV_DCRC2_control_cals_500V_200721.txt -HVdriftRate 0.031 -tSeries 60 -DCRCs2Flash 1 » ../../sequencer/HVdrift_5V_31mVps_nopre_60min.msl |
|---|---|
| 1423 | Start a 60 min series at HV = 5V, drifting 0.031 V/s, no prebias, CDMS detector: Driver Gains = 1x, DCRC4/1 QET biases = (0,320,390,0)/(0,360,420,440) uA, Front-End Gains = (3/3/3)/(5/5/5) 1000 BOR randoms, trigger on DCRC1pD threshold = 8 Use sequence HVdrift_5V_31mVps_nopre_60min.msl |
| 1425 | Vtest ~ 0.4 mV |
| 1425 | Tower = 53.9 mK |
| 1431 | Vtest ~ 1.0 mV. rising linearly. |
| 1438 | Vtest ~ 1.5 mV. rising linearly. |
| 1443 | Vtest ~ 2.0 mV. rising linearly. |
| 1455 | Vtest ~ 3.0 mV. rising linearly. |
| 1522 | Vtest ~ 5.0 mV. rising linearly. |
| 1529 | Vtest ~ 5.5 mV, just before end of bias drifting. |
| 1533 | Flash occurs at end of sequence: Tower spikes to 850 mK then begins to cool |
| 1603 | Tower = 60 mK, 30 minutes after the flash. Still cooling. |
| 1633 | Tower = 56.5 mK, 60 minutes after the flash. |
| 1703 | Tower = 55.3 mK, 90 minutes after the flash. |
| 1733 | Tower = 54.6 mK, 120 minutes after the flash. This is 1 mK above temperature before flash. |
| 1833 | Tower = 53.6 mK, 3 hours after the flash. About the same as before flash. |
| 2130 | Tower = 52.6 mK. Leveling out, cooler than previous overnight minimum. |
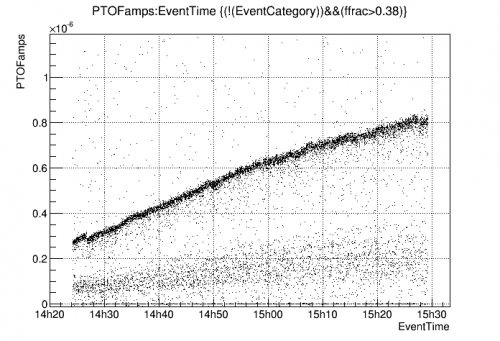 |
| Data from today. Clearly we are drifting the bias at too great a rate. Analysis suggests changing the rate from 0.031 → 0.026 V/s. |
| 2130 | Build a new sequence for 5-Volt data, with no pre-biasing, changing drift rate to 0.026 V/s. python HVscan.py -iDCRC 2 -HVs 5 -HVcalFile HV_calibrations/HV_DCRC2_control_cals_500V_200721.txt -HVdriftRate 0.026 -tSeries 60 -DCRCs2Flash 1 » ../../sequencer/HVdrift_5V_26mVps_nopre_60min.msl |
|---|---|
| 2136 | Start a 60 min series at HV = 5V, drifting 0.026 V/s, no prebias, CDMS detector: Driver Gains = 1x, DCRC4/1 QET biases = (0,320,390,0)/(0,360,420,440) uA, Front-End Gains = (3/3/3)/(5/5/5) 1000 BOR randoms, trigger on DCRC1pD threshold = 8 Use sequence HVdrift_5V_26mVps_nopre_60min.msl |
| 2138 | Vtest ~ 0.4 mV |
| 2140 | Tower = 52.6 mK |
| 2140 | MB = 44.0% |
| 2149 | Vtest ~ 1.0 mV. rising linearly. |
| 2216 | Vtest ~ 2.5 mV. rising linearly. |
| 2236 | Vtest ~ 3.5 mV. |
| 2043 | Drift stops, a bit late |
- In this recent data the Luke gain still clearly increases with time. Rate relative to t=0: 1.87/hour
- Here's a formula for correcting the drift rate:
- Rcorrect = - Rgain*(HVstart+eps/(eff_leak*eff_gap*eff_other))
- It turns out the correction depends on all of the HV “efficiencies”, including any unknown efficiency as observed in the last few runs….
- note that if HVstart is large enough, Rcorrect ~= Rgain*HVstart, and the efficiencies don't matter
- if we assume eff_other=1.0 : Rcorrect = -0.0046, new Rdrift = 0.0214 V/s
- if we assume eff_other=0.4 : Rcorrect = -0.0076, new Rdrift = 0.0184 V/s
- if I compare the results from both series and try to infer the unknown efficiency, I get 1.78, which doesn't make sense… if that were the case though we'd want Rdrift = 0.0223 V/s
- I guess we'll just use the naive estimate, 0.0214 V/s