2017/05/17 (Wednesday)
| Setup: DIB1/3/4 → 3.2 MHz filters 3/1/2 → cable 3/1/2 →gender changer 3/1/2 → HVConn 1/3/2 → HV 1/2 → DCRC55/DCRC33 | |
| PuBe source in paraffin barrel behind shield (west side) Na-22 source hanging along southeast column of fridge stand |
|
| Took NaI-triggered data overnight @50V, looks ok. | |
| 0830 | Tower/MC/Coldplate = 32.9/30.6/190 mK, Still = 1.25 K / 0.110 mbar, G1/G2 = 225/220 mbar, 1K Pot = 1.683 K / 26 mbar. Main Bath = 33.7%. |
| 0835 | Fill LN2 cold trap bath |
| 0835 | HV = 50.00 V, Vtest = 26.7 mV → Vdetector = 38.3 V. This is obviously a problem - the leakage current looked like it was getting a little worse, now it's a lot worse. |
| 0840 | Start 1 1-hour data series of 1-sided 50V HV coincidence data with Frontend Gain = (15/15/10)/(3/4/4), OG = 4/2, QET biases = table from Apr 28, with 1000 beginning randoms, no flashing, and a 20ADC bin threshold trigger on DCRC1 pA (Side1 pE). Running OR trigger of NaI detectors with PuBe source on west side of shield. NaI detector C has 311 mV threshold and detector B has 288 mV threshold |
| 1115 | Start dialing down HV in 10V steps, measuring Vtest after waiting 10 (or more) minutes after each step: |
| HV [V] | Vtest [mV] | Ileak [nA] | Vloss [V ] | Vdetector [V] | Rtot [GOhm] | Rleak [GOhm] | Gleak [nS] |
|---|---|---|---|---|---|---|---|
| 50 | 23.7 | 26.07 | 10.45 | 39.55 | 1.92 | 1.52 | 0.66 |
| 40 | 18.9 | 20.79 | 8.34 | 31.66 | 1.92 | 1.52 | 0.66 |
| 30 | 14 | 15.4 | 6.18 | 23.82 | 1.95 | 1.55 | 0.65 |
| 20.01 | 8.6 | 9.46 | 3.79 | 16.22 | 2.12 | 1.71 | 0.58 |
| 10 | 3.5 | 3.85 | 1.54 | 8.46 | 2.6 | 2.2 | 0.46 |
| 5 | 1.4 | 1.54 | 0.62 | 4.38 | 3.24 | 2.84 | 0.35 |
| Below are some leakage results over the last few weeks: |
| Date | HV [V] | Vtest [mV] | Ileak [nA] | Vloss [V ] | Vdetector [V] | Rtot [GOhm] | Rleak [GOhm] | Gleak [nS] |
|---|---|---|---|---|---|---|---|---|
| 1-May | 50 | 2.1 | 2.31 | 0.93 | 49.07 | 21.65 | 21.24 | 0.05 |
| 2-May | 50.01 | 1.1 | 1.21 | 0.49 | 49.52 | 41.33 | 40.93 | 0.02 |
| 2-May | 50.01 | 1.9 | 2.09 | 0.84 | 49.17 | 23.93 | 23.53 | 0.04 |
| 3-May | 50 | 2.7 | 2.97 | 1.19 | 48.81 | 16.84 | 16.43 | 0.06 |
| 3-May | 50 | 2.3 | 2.53 | 1.01 | 48.99 | 19.76 | 19.36 | 0.05 |
| 4-May | 50 | 2.2 | 2.42 | 0.97 | 49.03 | 20.66 | 20.26 | 0.05 |
| 4-May | 50 | 2.5 | 2.75 | 1.1 | 48.9 | 18.18 | 17.78 | 0.06 |
| 5-May | 50.02 | 1.5 | 1.65 | 0.66 | 49.36 | 30.32 | 29.91 | 0.03 |
| 5-May | 49.99 | 2.8 | 3.08 | 1.24 | 48.75 | 16.23 | 15.83 | 0.06 |
| 6-May | 49.99 | 3.9 | 4.29 | 1.72 | 48.27 | 11.65 | 11.25 | 0.09 |
| 7-May | 50.01 | 2.1 | 2.31 | 0.93 | 49.08 | 21.65 | 21.25 | 0.05 |
| 8-May | 50.01 | 1.6 | 1.76 | 0.71 | 49.3 | 28.41 | 28.01 | 0.04 |
| 8-May | 50 | 0.9 | 0.99 | 0.4 | 49.6 | 50.51 | 50.1 | 0.02 |
| 9-May | 49.99 | 5 | 5.5 | 2.21 | 47.78 | 9.09 | 8.69 | 0.12 |
| 9-May | 50 | 2 | 2.2 | 0.88 | 49.12 | 22.73 | 22.33 | 0.04 |
| 10-May | 50.01 | 4.7 | 5.17 | 2.07 | 47.94 | 9.67 | 9.27 | 0.11 |
| 10-May | 50 | 2.3 | 2.53 | 1.01 | 48.99 | 19.76 | 19.36 | 0.05 |
| 11-May | 50 | 2.4 | 2.64 | 1.06 | 48.94 | 18.94 | 18.54 | 0.05 |
| 12-May | 50.01 | 2.6 | 2.86 | 1.15 | 48.86 | 17.49 | 17.08 | 0.06 |
| 13-May | 50.03 | 1.6 | 1.76 | 0.71 | 49.32 | 28.43 | 28.02 | 0.04 |
| 17-May | 50 | 23.7 | 26.07 | 10.45 | 39.55 | 1.92 | 1.52 | 0.66 |
| Vtest measurements in bold were taken at the end of an overnight sequence. Others were taken at the beginning shortly after setting the HV. |
||||||||
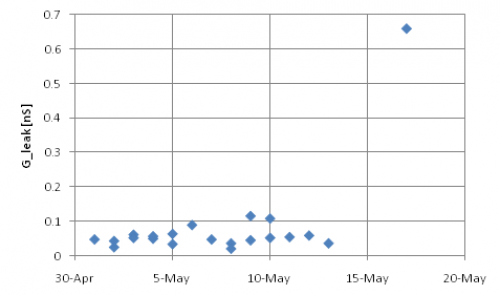 | There has maybe been a slow upward creep in the last few weeks, with today an obvious outlier. Over the last few days the Vtest wasn't measured so it may have been bad then too. On May 9 and 10 there is a clear pattern that after an overnight span at HV = 50V, the leakage increased significantly compared to the beginning of the overnight data sequence. Before that date this pattern was not present. |
| 1245 | Dial HV down to 0V |
|---|---|
| 1318 | Set HV=50V and measure V_leak every ~min for 20 mins. The V_leak measurements seem to jump around a bit when the probe tips are first applied to the test points. It looks like the test point plating may be degrading from so much use. This seems to cause artificially low V_leak measurements unless one is careful to apply the probe tips firmly and wait ~10 seconds for it to settle. Placing the probes on the solder blobs on either side of the test resistors seem to give more stable readings. Regardless, the stable leakage current is still elevated from previous values. |
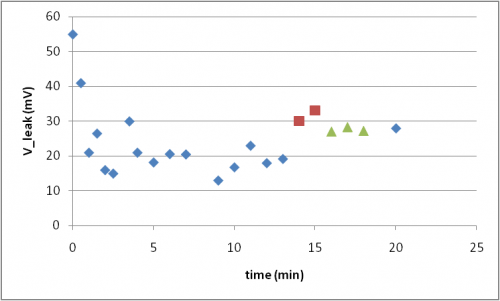 | The leakage seems to show a rough exponential decay, though there is considerable uncertainty in the measurements due to poor electrical contact with the voltmeter. The red and green points were each taken without removing the probes between measurements. |
| 1327 | Start LHe transfer @ Main Bath = 26.2% |
|---|---|
| 1425 | Cease LHe transfer @ Main Bath = 91.7% |
| 1443 | Investigating leakage current measurements. Have found that measurements can vary by 10s of mV depending on how the probes are held/how the voltmeter cables are bent. This is true for 2 different meters and probes. In particular, it seems very sensitive to pressing/pinching whichever probe wire is connected to the power supply side of the test resistor. |
| 1503 | Try measuring with V_leak with Fluke 8700A multimeter which is rated at >1000 MΩ input impedance vs. >10MΩ for the Fluke 87V which we normally use. This seems to give a similar steady voltage of 24.9 mV, but takes longer to settle (bigger RC now??) It is also sensitive to movement of the wire on the power supply side. |
| NOTE: | With the Fluke 8700A the conversion from HV to Vdetector should be Vdetector[V] = HV[V] - 0.4004*Vtest[mV] |
|---|
| 1521 | Attach Fluke 8700A meter to test points using BNC cable and small clips with milmax pins stuck into test points. Measurements seem stable like this. Turn down HV to 0V and watch V_leak this way. Measurements seem more reliable now. |
|---|
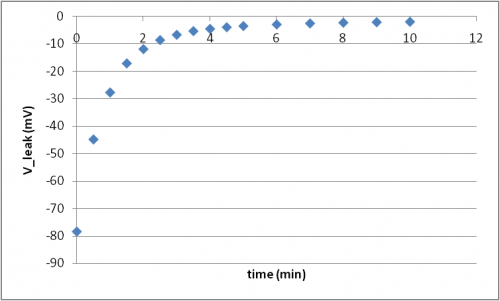 | V_leak after turning HV from 50V to 0V as measured by Fluke 8700A with connections in place for entire time period. |
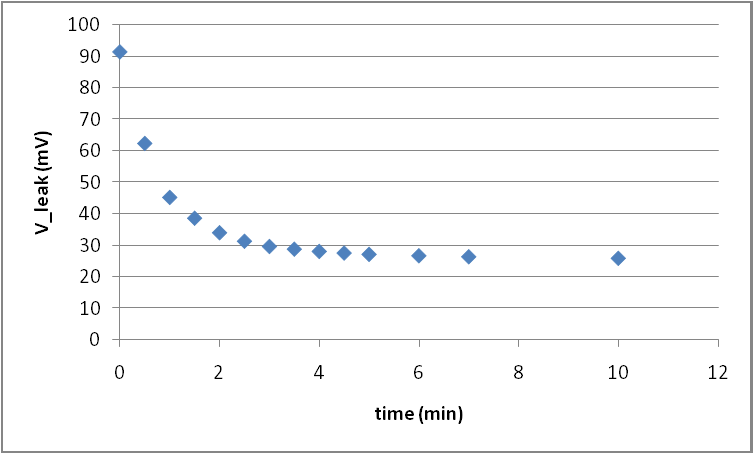
| 1546 | Now turn HV back up to 50V and measure V_leak again. Results below show a steady-state V-leak=26mV and a decay with time constant of 1.6 min. |
|---|
| 1602 | Set HV=0V |
|---|---|
| 1607 | Stop DCRC programs and power down DCRCs 1,2. Tower temp spikes to 50mK then returns to base. |
| 1610 | Unplug detector cables from back of HV board, leaving gender changers attached to HV board. Turn up HV bias while measuring V_leak with Fluke 8700A as above. Results show little leakage in the HV board and DCRCs |
| DCRCs, HV board,a nd gender changers | |
|---|---|
| HV [V] | Vtest [mV] |
| 0.002 | -0.05 |
| 5.01 | -0.05 |
| 10.03 | 0.06 |
| 20.03 | 0.07 |
| 50.01 | 0.44 |
| 80.0 | 0.45 |
| 1619 | Set HV=0V. Plug detector cables into HV board but unplug them from the ebox, leaving the pi filters on the cables. With HV grounded, V_leak is already measuring -1.5mV, though it falls to -0.64mV within a few minutes. It looks like there is some time dependence with the cables now. Let's repeat the exercise of watching the decay in leakage after going from 0→50V bias. Results below show a steady-state V_leak=3mV and a decay with time constant of 1.5 min. The decay time is similar to that with the cables connected to the ebox, but the steady state leakage is much lower. |
|---|
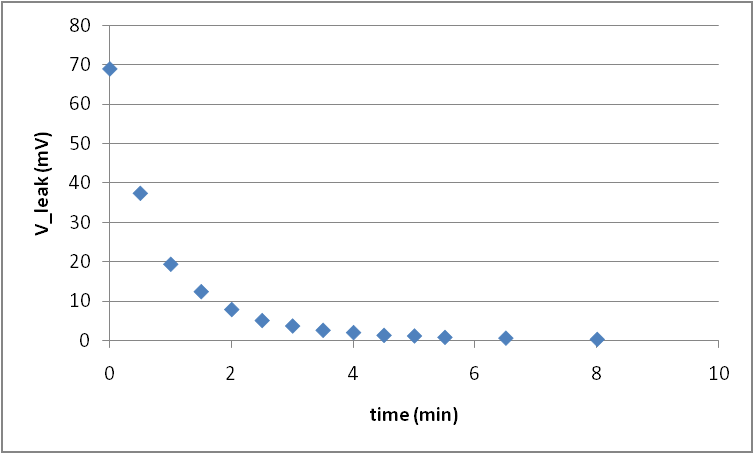 | V_leak after turning HV from 50V to 0V with detector cables unplugged from ebox. |
| The above tests indicate that neither the HV board nor the cables/filters/gender changers are responsible for the high leakage. Though the cables may play a strong role in determining the time scale of leakage current decay. |
| 1700 | Plug detector cables back in. Power on DCRCs 1,2 and restart DCRC programs. Tower temp spikes to 300mK before cooling to base. |
|---|---|
| 1703 | Zap SQUIDs on DCRCs 1,2 |
| 1715 | Looks like we've got all channels back. |
| 1718 | Dial HV up to 65V. Vtest goes to 120 mV at first (Vdetector = HV-0.404*Vtest = 17 V), then falls to 38 mV after 5 minutes. Then dial down to 50 V |
| Actually the leakage at 65V gets us close to 50V at the detector. We should probably set the bias close to that. Which means prebiasing to like 80V. | |
| 1727 | Dial HV up to 80 V. After 5 minutes start dialing down, targeting 50 V at detector. |
| 1745 | Settle on HV=64.0 V with V_test=35.25mV ⇒ Vdetector = HV-0.404*Vtest = 49.8 V |
| 1756 | Crap, we forgot to bake today… Set HV=0V. Begin 1 hour bake. |
| 1911 | begin detector prebias, dial up to 80V, leakage monitor begins at 134mV, decreasing now |
| 1922 | settles around 39 mV, or about 64V, dial down to 50V, try 64V apparent, leakage monitor starting at 13mV but rising, wait until settle |
| 1924 | we are cooled down to about 37mK, wait for further cooling |
| 1933 | leakage settled around 30.11 mV, true voltage is 51.8V, let's perturb down a bit, say 62.2V |
| 1950 | “stable” at 62.2V apparent, 38.38mV leakage, for about 49.9V true |
| 1953 | oscillatory behaviour (hair) on the peaks of DIB1 channel C |
| 1955 | Start 13 1-hour data series of 1-sided 50V HV coincidence data with Frontend Gain = (15/15/10)/(3/4/4), OG = 4/2, QET biases = table from Apr 28, with 1000 beginning randoms, no flashing, and a 20ADC bin threshold trigger on DCRC4 pA (external trigger). Running OR trigger of NaI detectors with PuBe source on west side of shield. NaI detector C has 311 mV threshold and detector B has 288 mV threshold |