Previous Day
| | Setup: iZIP mode, DIB1/2/3 → cables → 3.2 MHz filters → DCRC55/33/50, DCRCs powered overnight |
| | Temperature stable overnight |
| 0855 | Tower/MC/Coldplate = 52.0/47.7/281 mK, Still = 1.13 K / 0.120 mbar, G1/G2 = 110/105 mbar, 1K Pot = 1.68 K / 9.5 mbar, Main Bath = 76.7% |
| 0905 | Fill LN2 cold trap bath. |
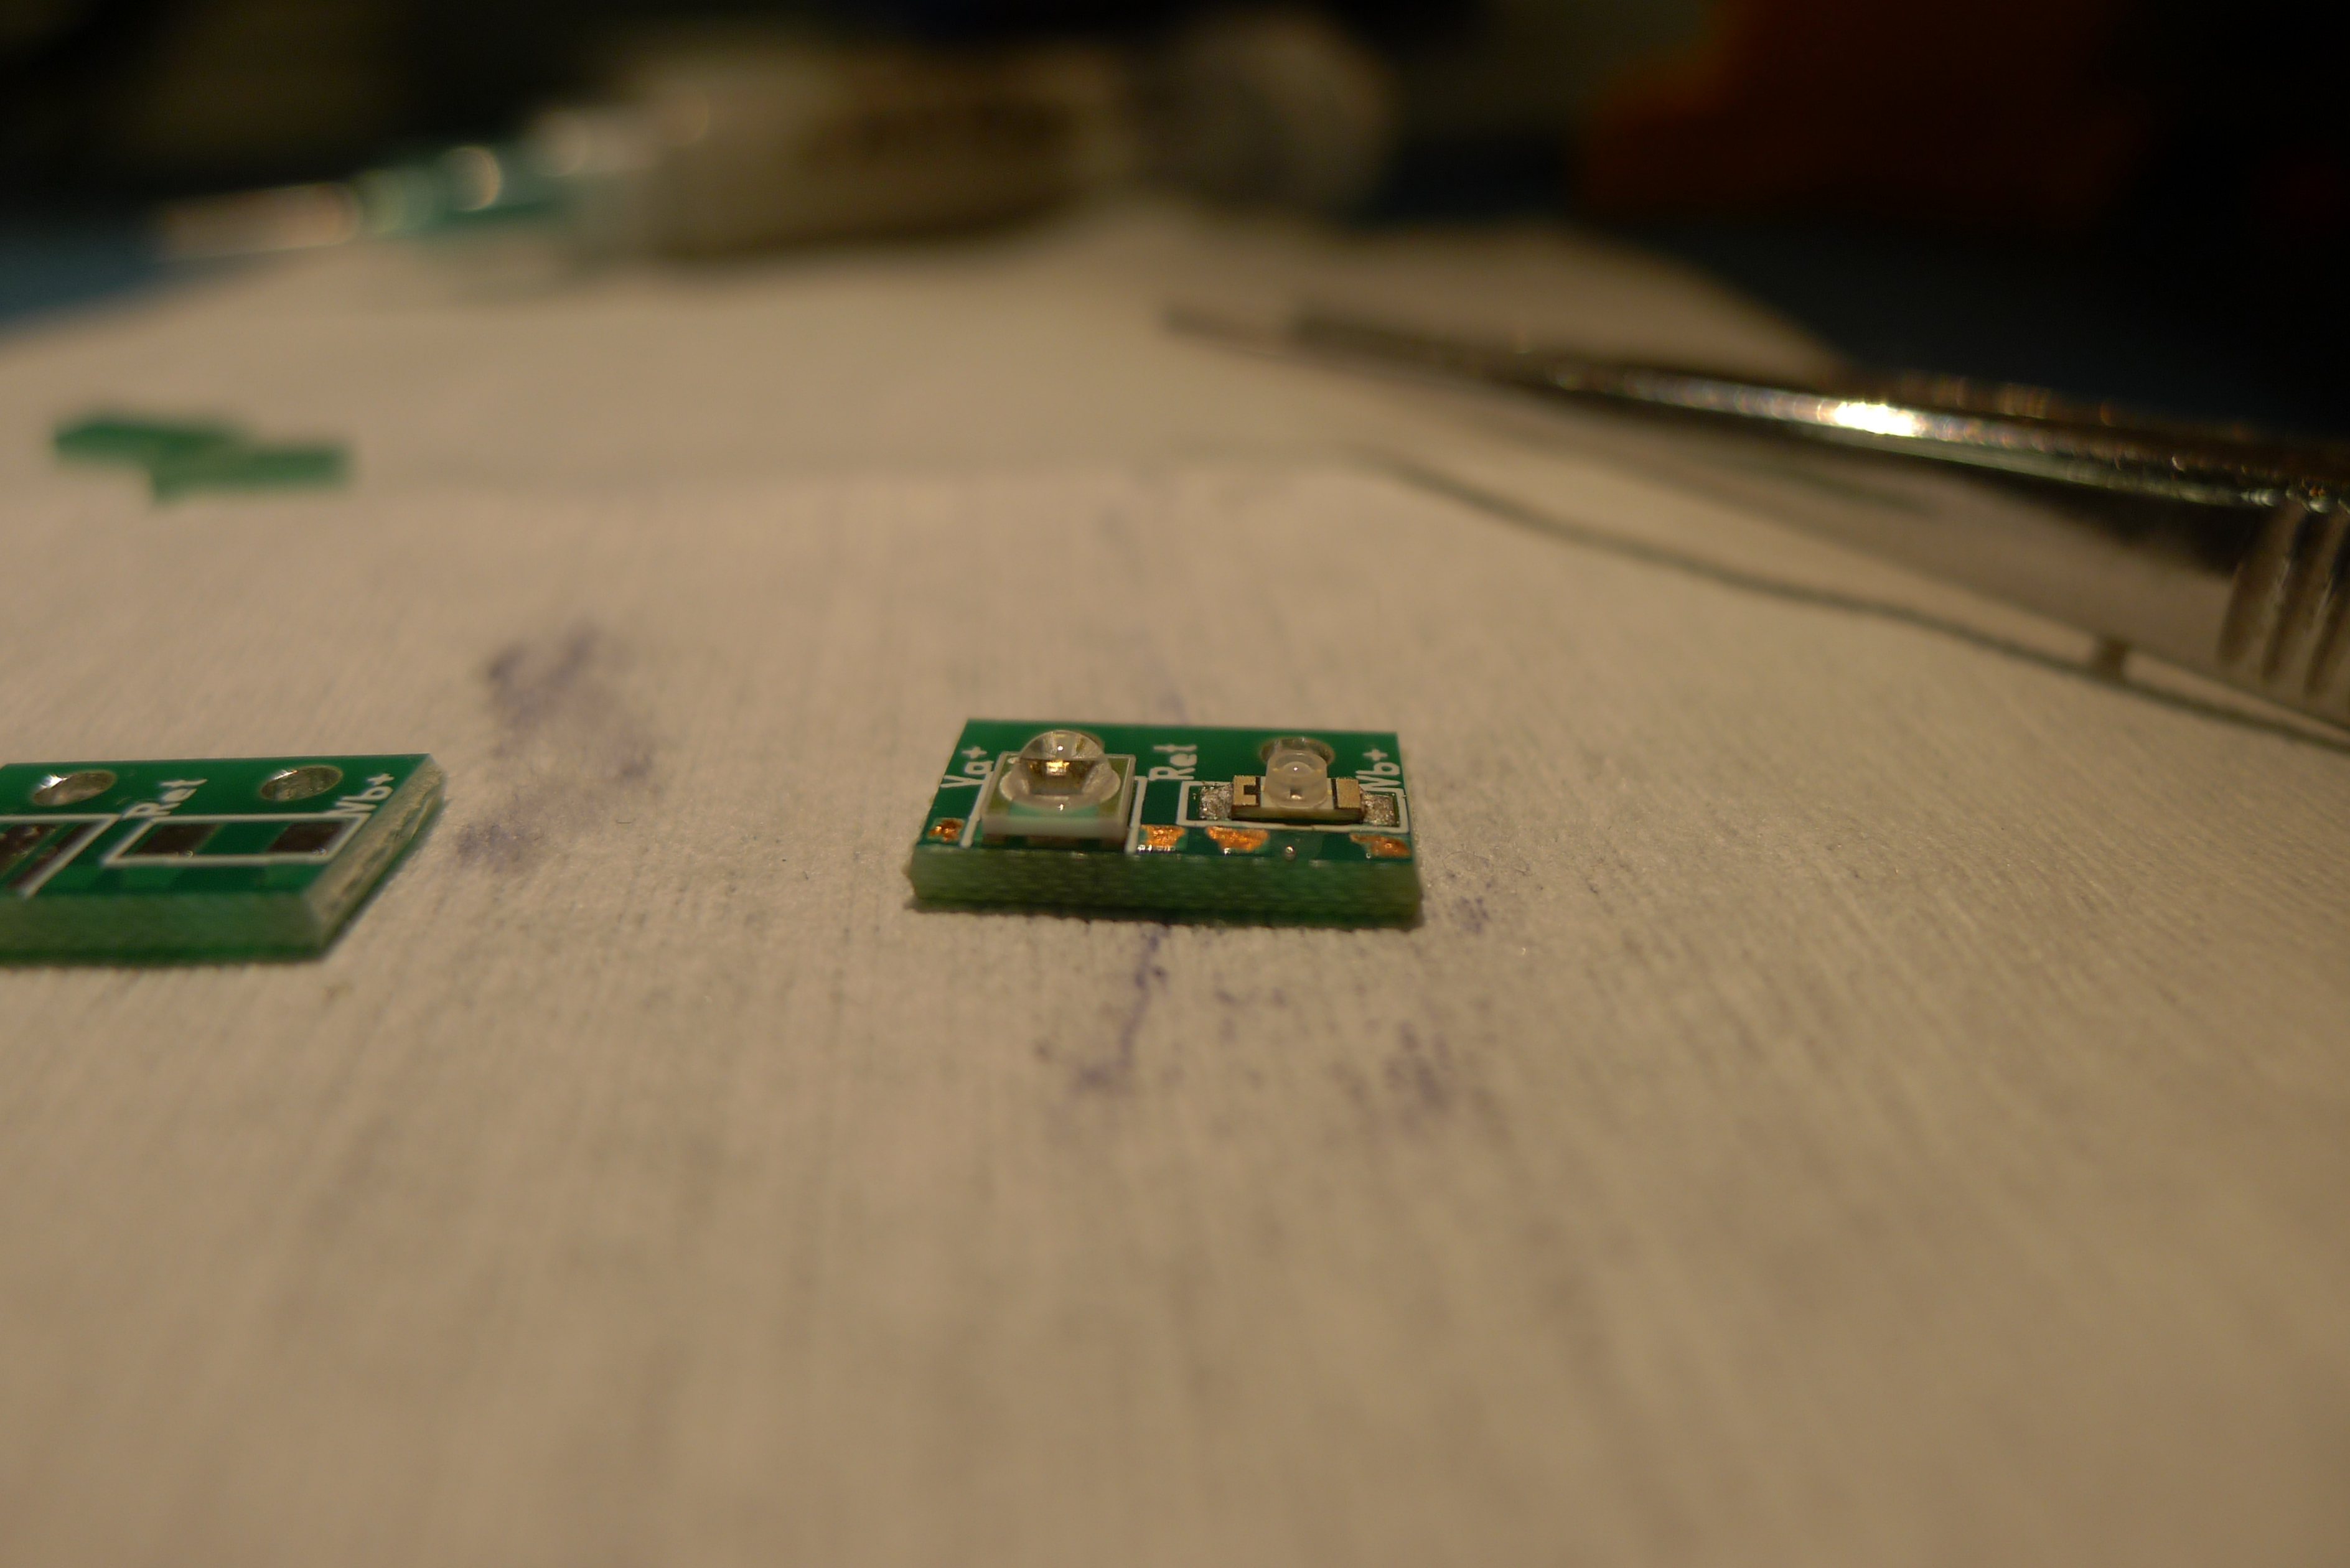
| 1215 | Did a trial run of using hot plate for reflow soldering LED boards for 150mm detector. Applied solder paste to boards and placed LED components. Set temperature to 300C on Corning PC-420D, monitored chip temp with IR thermometer. After ~ 5 min solder began to flow at ~220C. After ~ 15-30 seconds, removed chip with tweezers. Had to repeat procedure twice after an initial solder bridge. |
| 1220 | Prepare for another 1-shot test in order to measure Tc's for DIB3. Unplug other two DCRCs to drop temperature even more. |
| 1240 | Tower temperature: 48.7mK and fairly stabilized after unplugging DCRCs. DIB3 pB still not showing test signal above the ~8mVpp noise. Other three channels show triangle waves in normal region. |
| 1245 | Commence 1-shot while monitoring the three working channels. |
| | SC → Transition [mK] | Transition → Normal [mK] | Normal → Transition [mK] | Transition → SC [mK] |
| | | | | |
| DIB1 pA* | <43.9 | <43.9 | <43.9 | <43.9 |
| DIB1 pB | – | – | – | – |
| DIB1 pC | <43.9 | <43.9 | <43.9 | <43.9 |
| DIB1 pD | <43.9 | <43.9 | <43.9 | <43.9 |
| | | | | |
| DIB3 pA | – | – | – | – |
| DIB3 pB* | <43.7 | <43.7 | <43.7 | <43.7 |
| DIB3 pC | 43.9 | 45.2 | 46.7 | 43.5 |
| DIB3 pD | <43.7 | <43.7 | <43.7 | <43.7 |
| | | | | |
| *Note: | For DIB1 pA DIBs 3 pB, no triangle wave was visible over the noise,
so no Tc measurements could be made. DIB 3 pC transition to normal temperature was taken while temperature was rising very quickly. |
| 1300 | Unpower DCRC3, repower DCRC1 and zap SQUIDs. Pull up test signal on QET lines. DIB1 pA still doesn't show the test signal. |
| 1315 | Current tower temperature: 48.9mK DIB1 pB showing signs of transitioning from Normal to Transition. |
| 1325 | During the one-shot, we thought we saw DIB1 pB transition from Normal to into the transition region. However, as we cooled down, we never saw any evidence of pulses, just a wavey and unstable triangle wave. Then when warming up, pB never assumed the form of a steady normal triangle wave even at temperatures of ~80mK. So perhaps it never showed signs of transition and instead it's just an unstable channel. |
| 1340 | Set up DCRC2 and unpower DCRC1. Send test signal down QET lines. DIB2 pA not showing the triangle wave. Current tower temperature: 49.3mK. Still could cool more before one-shot. |
| 1345 | We see transition region pulses on DIB2 pB & pC, so apply 10mW of MC heat to check for transitions on the normal end. Then let the tower cool back to base and watch for transitions on the way down. Couldn't get pC superconducting, so we'll do a single-shot. |
| 1405 | Commence single-shot test. |
| | SC → Transition [mK] | Transition → Normal [mK] | Normal → Transition [mK] | Transition → SC [mK] |
| | | | | |
| DIB2 pA | – | – | – | – |
| DIB2 pB | 49.0 | 49.7 | 49.6 | 48.2 |
| DIB2 pC | 49.8 | 51.8 | 53.4 | 49.5 |
| DIB2 pD | 52.5 | 54.0 | 55.5 | 52.8 |
| Minimum temperature of 46.7mK. | | | | |
| 1500 | Main bath = 68.3% |
| 1505 | Mini-IbIs on DIB2 to re-measure Rn values. Tower=47.5 mK |
| 1530 | Turn on DCRC1 (did not bother to zap). Tower=49.8 mK. Do Mini-IbIs on DIB1 |
| 1600 | Turn on DCRC3 (did not bother to zap). Tower=51.8 mK. Do Mini-IbIs on DIB3 |
| Rn's from Mini-IbIs |
| | Rn [Ω] | | Rn [Ω] | | Rn [Ω] |
| DIB1 pA | >200 | DIB2 pA | 0.357 | DIB3 pA | 0.330 |
| DIB1 pB | 0.319 | DIB2 pB | 0.592 | DIB3 pB | >800 |
| DIB1 pC | 0.527 | DIB2 pC | 0.415 | DIB3 pC | 0.257 |
| DIB1 pD | 0.306 | DIB2 pD | 0.548 | DIB3 pD | 0.416 |
Method:
measure phonon baseline at two QET biases: 200 μA and 300 μA (+ for DCRC1&3, - for DCRC2)
R = [ (Gtot * Rf * ΔIb) / (ΔVout) - 1 ] * Rshunt
where
Gtot is the total gain = output gain * DCRC gain (2/5/2) * loop gain (10.5)
Rf is the feedback resistance, 1233 Ω
ΔIb is the absolute difference in QET biases (100 μA in this case)
ΔVout is the absolute difference in phonon baseline (in V)
Rshunt is the shunt resistance, 20 mΩ
Two phonon channels barely changed, so their measured resistances are very high. They are probably essentially open.
Note that this (probably correct) method gives very different results from the resistances inferred from test signals measured on Wednesday. Those values are 6.7 times greater on average. So something is wrong with the normalization. It is as if Rb (the QET bias resistance) is around 6.8 kΩ rather than 1 kΩ. Update: informed by Matt Pyle that the QET bias resistance was changed from 1 kΩ to 10 kΩ, and we found the component on DCRC 50 and confirmed with a multimeter.
| 1647 | Fill LN2 cold trap full. |
Next Day