2016/04/28 (Thursday)
| Setup: iZIP mode, DIB1/2/3 → cables → 3.2 MHz filters → DCRC55/33/50, DCRCs powered overnight | |
| Overnight, occasional spikes in MC temperature. Increases by about 6 mK in about 60 seconds, then falls back to base in about 3 minutes. Happened around 0:00, 8:50, 9:20. | |
| Similar to the much more frequent spikes seen when the still heater was on yesterday | |
| 0900 | Tower/MC/Coldplate = 52.1/49.5/314 mK, Still = 1.30 K / 0.130 mbar, G1/G2 = 115/115 mbar, 1K Pot = 1.70 K / 12 mbar, Main Bath = 37.8% |
| 0905 | Fill LN2 cold trap full. |
| 1140 | Tower/MC/Coldplate = 52.8/50.1/304 mK |
| 1145 | Having issues applying a triangle wave to DCRC2 pD for purposes of watching transition during one-shot test. Decide to do a purely cryo one-shot, so unpower DCRCs. |
| 1200 | Base temp is falling by several mK |
| 1230 | Tower/MC/Coldplate = 46.0/43.1/274 mK |
| 1231 | Start one-shot: close V13, open V9 |
| during one-shot adjust still heat to keep still P near 0.100 mbar. Went as high as 4 mW. |
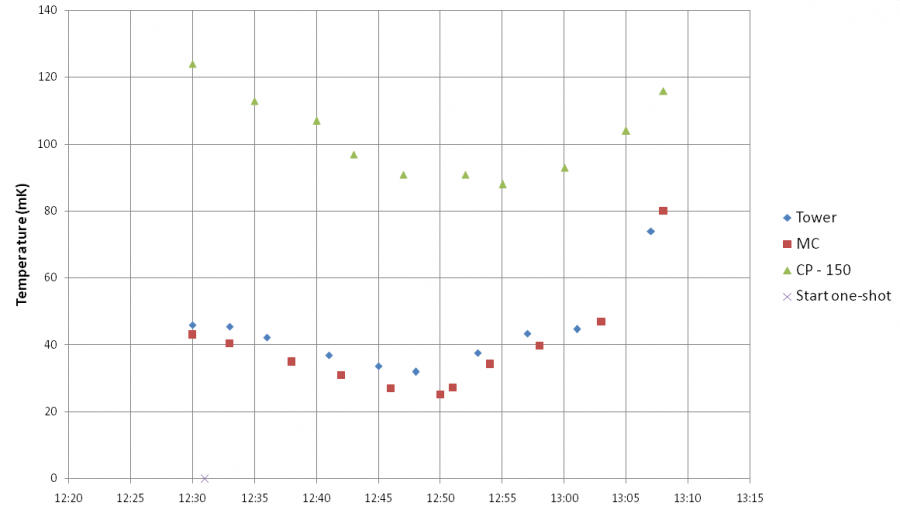
- Tower fell to 32.0 mK minimum, 14 mK below the base during circulation
- MC fell to 25.1 mK minimum, 18 mK below the base during circulation
- Coldplate fell to 238 mK minimum, 36 mK below the base during circulation
- Coldplate never got hotter, unlike in run 52
- Tower-MC difference increased during cooling to about 6 mK, from about 3 mK during circulation
- Temperature reached minimum about 20 minutes after beginning one-shot (would it be slower without still heating?)
- G1 fell to 6 mbar during one-shot
- G2 fell to about 22 mbar then rose, to about 60 mbar when temperature reached minimum, then continuing to about 105 mbar when we stopped the one-shot
- Since base temperature is about 7 mK higher with DCRCs on, can probably reach 39 mK minimum on tower during one-shot with DCRCs on
| 1310 | End one-shot: close V9, open V13a, turn off still heat. |
|---|---|
| 1311 | Open V14 to let mix from dump back to circulation. G2 rises from 80 mbar to 300 mbar, then begins to fall again. |
| 1315 | Tower T has risen to 205 mK, now falling again |
| 1330 | Tower = 58 mK |
| 1335 | P1 has fallen to 0.9 mbar. Close V14, back to normal circulation. |
| 1340 | Tower = 50.8 mK |
| 1350 | Tower = 47.9 mK and cooling |
| 1410 | Power on DCRCs and Zap SQUIDs. |
| 1420 | Open SQUID Tuning GUI and apply the 12mVpp 100Hz triangle wave down DIB2 QET lines. DIB2 has Frontend Gains of 2 and Output Gains of 3. DIB2 pA's triangle wave still lost in the noise (~4mVpp noise), but when applying a 500mVpp triangle wave, it shows a 16mVpp modulation-curve-style wave over the noise. |
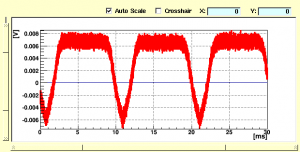 |
| As seen above, the wave looks like a truncated triangle wave. Extrapolating a possible peak to peak for the un-truncated wave gives ~~30mVpp. | |
| 1425 | Current tower temperature: 56.6mK. Close V13A and open V9 to commence one-shot cooling test. Temperature spiked to 59mK then began falling quickly. |
| 1430 | All channels on DIB2 (besides pA because we can't tell) have gone superconducting. Close V9, open V13A to recommence circulation. |
| 1431 | Open V14 to let mixture in dump back into circulation. Temperature begins rising very quickly making Tc measurements inaccurate or impossible. |
| 1434 | Tower temperature has risen to 73.3mK, and is now cooling back to base. |
| 1505 | Commence LHe transfer (27.9%). |
| 1540 | Current tower temperature: 51.7mK. Apply the 12mVpp 100Hz triangle wave down DIB1 QET lines. DIB1 has Frontend Gains of 5 and Output Gains of 8. DIB1 pA does not show a triangle wave, but instead white noise of 6mVpp. |
| 1542 | Commence one-shot test. |
| Despite getting down to 46mK, none of the channels on DIB1 showed any sign of going into transition. | |
| 1555 | Cease LHe transfer when dewar runs empty (39.4%). The dewar should have had more in it, but it must have gotten mostly used up during our long transfer on Tuesday. It seems like it's taking longer than usual to find a steady rate of filling for the LHe transfers this run. |
| 1630 | Recommence LHe transfer with new dewar (37.3%). |
| 1645 | We've collected as much Tc data as we could for DIBs 1 & 2 using the one-shot method, but the fridge did not get cold enough (at 46mK) to see any transitions on any channel on DIB1 (all still normal). The results are published below: |
| SC → Transition [mK] | Transition → Normal [mK] | Normal → Transition [mK] | Transition → SC [mK] | |
|---|---|---|---|---|
| DIB1 pA* | – | – | – | – |
| DIB1 pB | – | – | – | – |
| DIB1 pC | – | – | – | – |
| DIB1 pD | – | – | – | – |
| DIB2 pA* | – | – | – | – |
| DIB2 pB | – | 48.6 | – | 48.7 |
| DIB2 pC | 47.0 | 48.6 | – | 48.2 |
| DIB2 pD | – | 53.2 | 54.0 | 52.5 |
| *Note: | For both pA channels on DIBs 1&2, no triangle wave was visible over the noise, so no Tc measurements could be made. |
|||
| 1705 | Close V14 with P1: 0.22mbar. Closing V14 causes P1 to drop further. |
|---|---|
| 1735 | End LHe transfer (92.8%). |
| 1738 | Fill LN2 cold trap. |
| 1746 | Let pressure out of main bath. |