| 1325 | Try applying bias to HV bias input with Kepco 0-40 V DC power supply. Lots of noise in phonon pulses when the ground side of the bias was connected anywhere on the power supply. Plugged the power supply into a Variac to isolate it from wall ground. This seems to have fixed the noise problem (it is at least much smaller). |
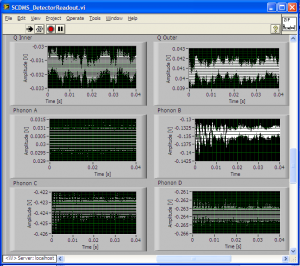
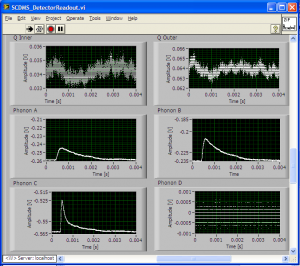
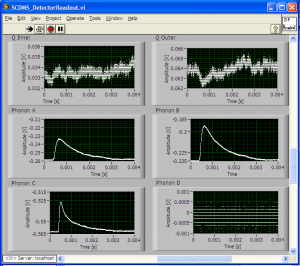
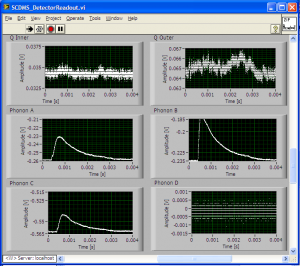
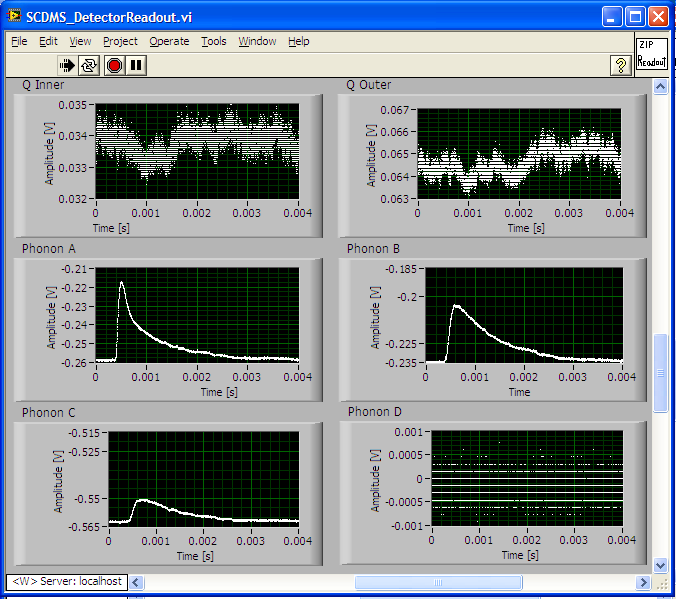
| 1335 | Try increasing HV bias (on Side 2) in positive direction. At > +16 V, phonon pulses disappear. Below this the phonon pulses look fine. Easily repeatable pattern. At no point is tower temperature affected. (Voltages read off the gauge on the Kepco supply.) |
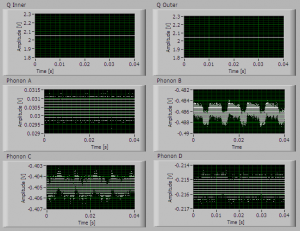
| 1342 | Try increasing HV bias (on Side 1) in negative direction. At < -19 V phonon pulses disappear. Also see strange pulses shapes for a brief moment after adjusting the voltage dial - sort of like square pulses but curved on the rising edge, a bit like a shark fin. |
| 1402 | Troubleshooting charge channels: why is nothing seen in the charge traces on HV1? Measure charge-related resistances on breakout box connected to 1) DIB1 at the ebox and 2) HV1. Discover that FET heater reads open at HV1; c/w 1.24 kΩ at ebox. Other readings are the same at HV1 versus the ebox. Turns out this was a mistake in the design - the FET heater leads were not connected to anything. |
| 1500 | Disconnected HV board and modified it at the bench so that the two FET heater leads from DIB1 are connected to the appropriate leads on HV1. Soldered wire from one D-sub post to the other. |
| 1645 | Reconnect HV board after modification: DCRC50/55 → no filter/10MHz filter → HV slot 1/2. Now that the FET heater is connected, pulses can be seen on the HV1 charge channels. |
| 1645 | HV2 QET biases increased by 20 μA from values used before the filter was present. |
| 1650 | On HV2pB there is low frequency noise, and pre-pulse negative spikes if the HV coax is connected |
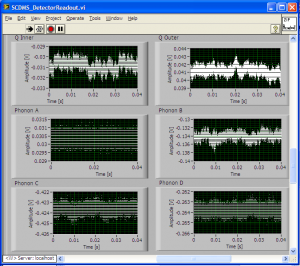
| 1705 | Try adjusting both the HV bias and the Side1 bias. At -5V crystal bias and 0V side1 bias, most charge pulses are positive but some are negative. Suspect that a non-zero side1 bias would reduce the rate of negative pulses. At -5V/+3V crystal/side1, negative pulses are much rarer. At -10V/+5V there may have been hints of additional phonon noise. |
| 1710 | With the Side1 bias at +5V we watched the phonon signals as we increased the crystal bias from -10V to -18V to see how more details of how the breakdown occurred. The phonon baselines rose shortly before the pulses disappeared. We also watched the current meter on the voltage supply. Spikes in current around 10 mA could be seen when the voltage was being adjusted but there was no discernible difference between the current before and after breakdown within the sensitivity of the gauge (it would need to be at least a few mA to be noticeable). |
| 1715 | Fill LN2 cold trap Dewar |
| 1720 | Observe that HV2pB look worse with filter present. They are clearly too small and rather messy looking. |
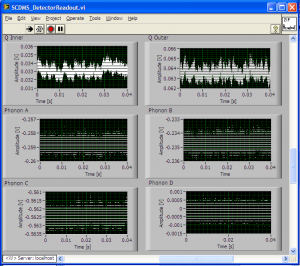
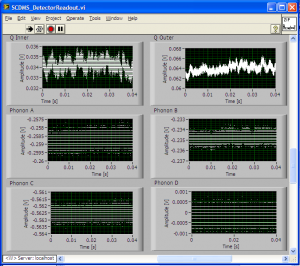
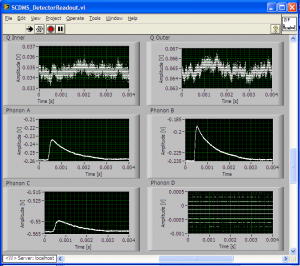
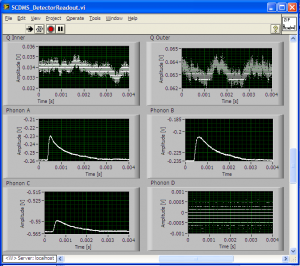
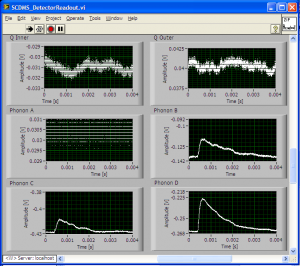
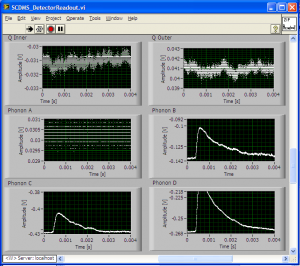
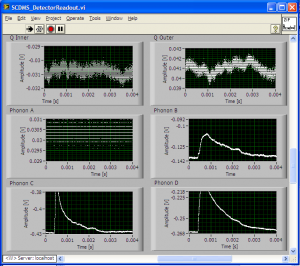
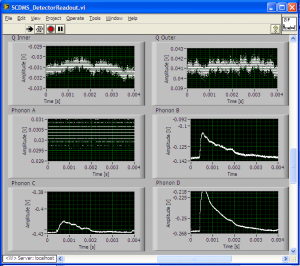
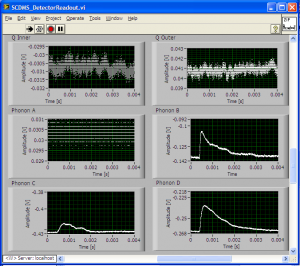
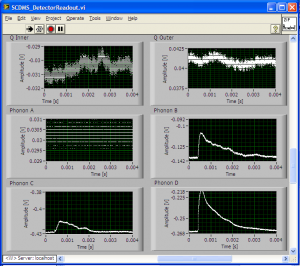
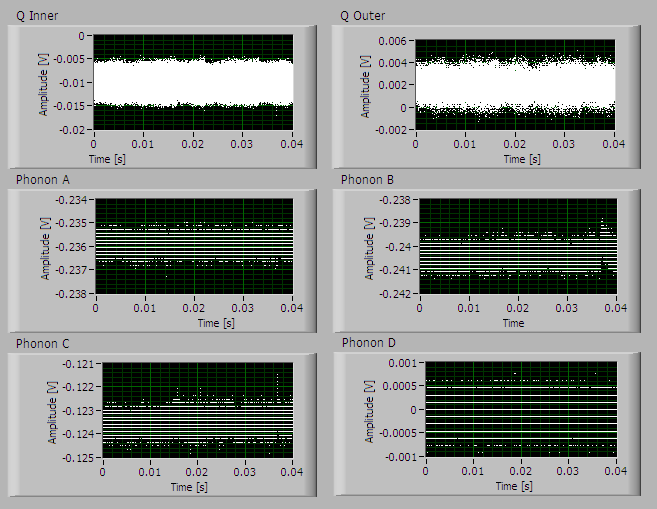
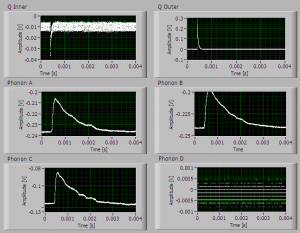
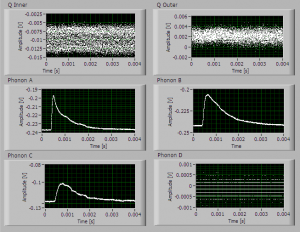
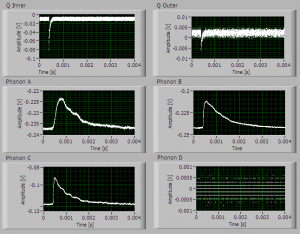
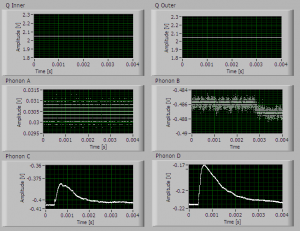
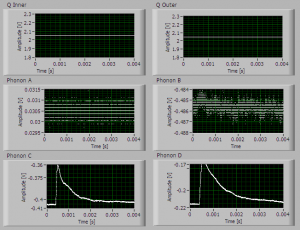
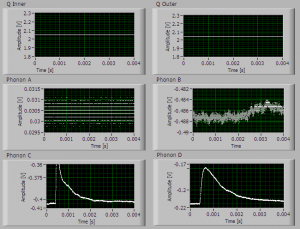
| 1735 | Took images of pulses and noise at 0V bias. For pulses, used phonon triggers of 10/15/10 on HV1pA/B/C and 10/10 on HV2pC/D. |