−Table of Contents
K100 Simulation
NEW: installation notes for new CentOS computers: CentOS installation
NEW: instructions for processing and analyzing Geant4 results in Root: root_analysis
The purpose of this page is to document the progress of the K100 geant4 simulation. This simulation includes the poly-lead shield as well as accurate measurements for detector G103a (100mm), which was used in Run 31. The overall goal of this simulation is to compare the data from Run 31 to that of the simulation to get a more complete look at the effects of the poly-lead shield. Original code for the K100 simulation from Bjorn Mellem can be found here.
Visuals of K100 Simulation
| Figure 1: Visual of K100 Simulation |
|---|
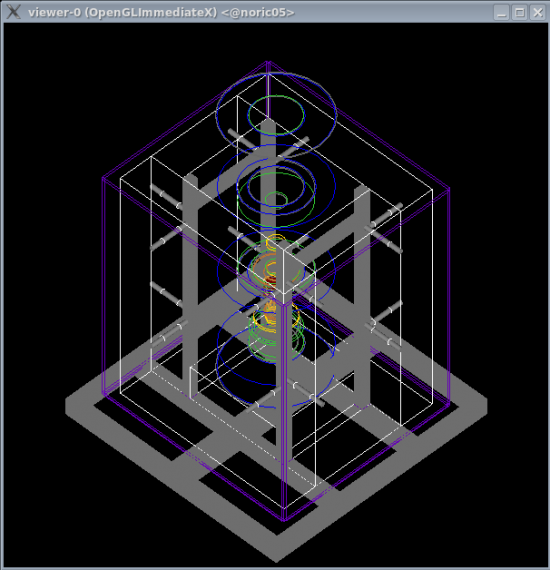 |
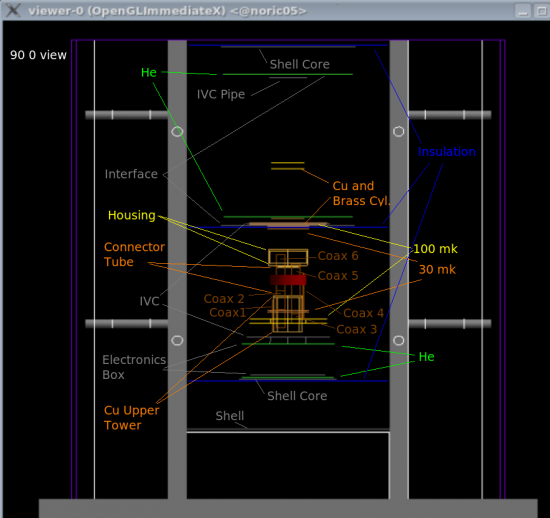
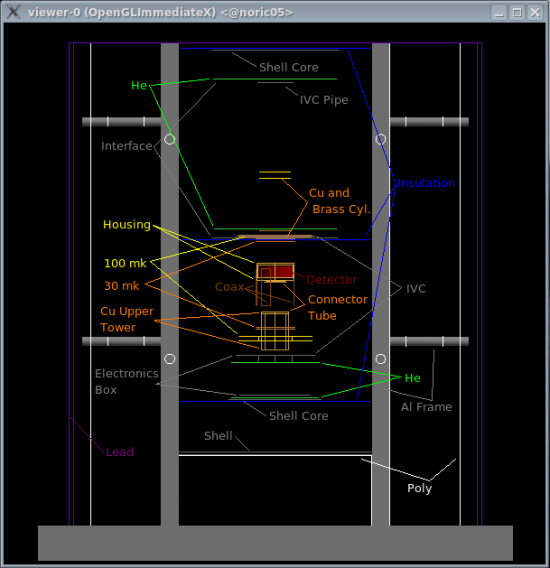
The figure above shows a regular K100 simulation visual with no events. The outer edges of the fridge are shown in blue, the poly shield in white with frame in solid grey, and the lead shield in purple. Figure 2a below shows the internal structure of the k100 fridge simulation. Note that this image was taken before important changes were made, which is why there are six coaxs and the detector is below its housing. These issues have been corrected to reflect the structure of G103a and Run 31, as can be seen in Figure 2b. Labels reflect those given in the code and are not necessarily labels commonly used.
| Figure 2a: Internal Structure of K100 Simulation Before Changes | Figure 2b: Internal Structure With Changes |
|---|---|
 |  |
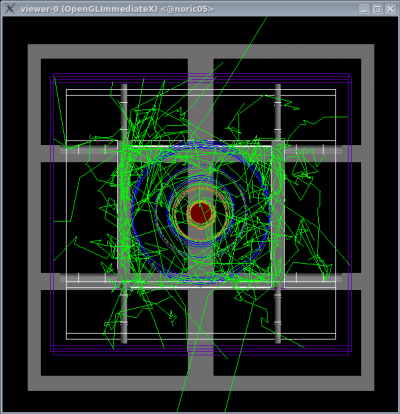
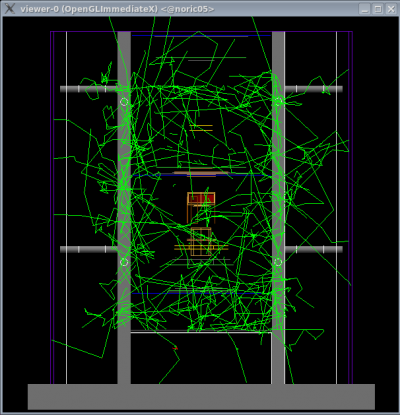
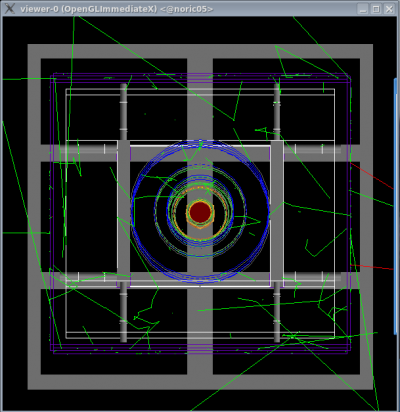
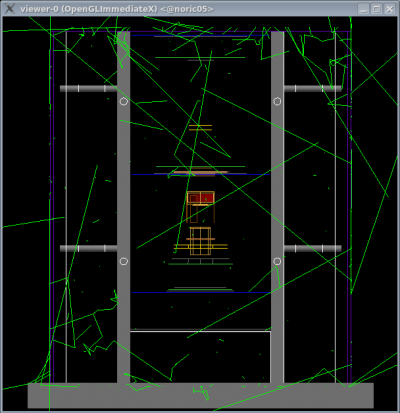
For this simulation, events are simulated in a surface either inside or outside the poly-lead shield. The events are to be directed inward but otherwise have an isotropic distribution. The next two figures below demonstrate these event distributions.
| Figure 3: 200 Gammas: Inside Shield | |
|---|---|
 |  |
| Figure 4: 200 Gammas: Outside Shield | |
|---|---|
 |  |
Initial Data
| Figure 5: Background Spectrum Expected and Actual | |
|---|---|
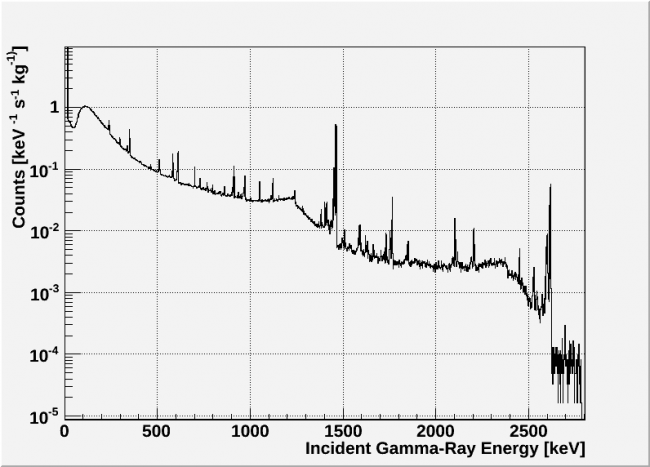 | 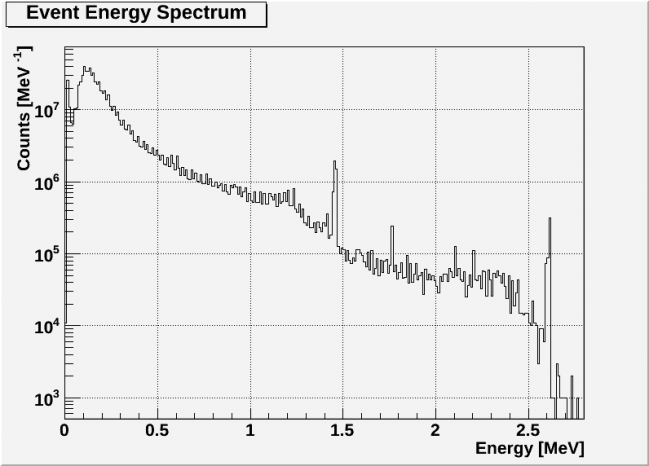 |
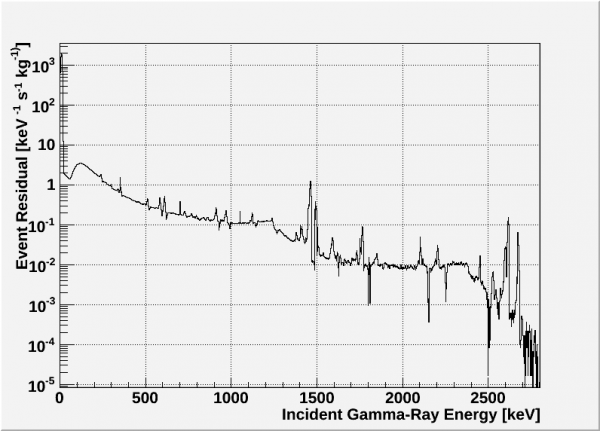
There are some issues with getting Figure 5 to bin properly, which explains the odd looking noise between 1.5 and 2.5 MeV. I hope to have this fixed soon. Regardless, the figure does demonstrate that the desired background is used for the initial energy of the gammas.
| Figure 6: Positions of Events in Detector: Inside Shield | |
|---|---|
 |  |
| Figure 7: Positions of Events in Detector: Outside Shield | |
|---|---|
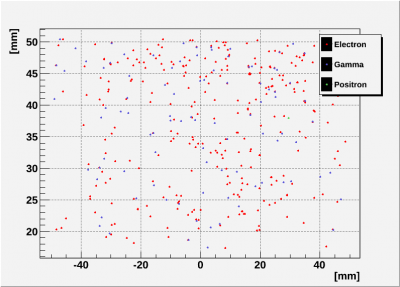 | 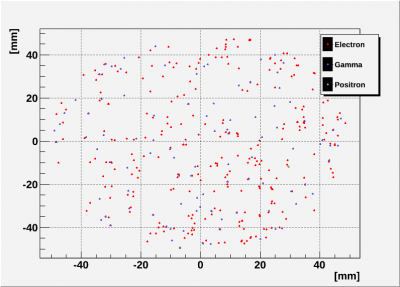 |
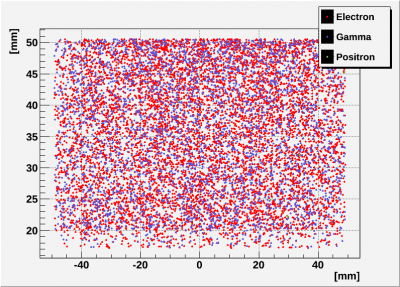
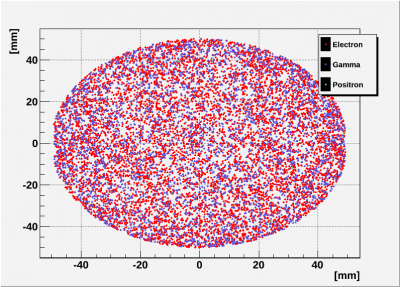
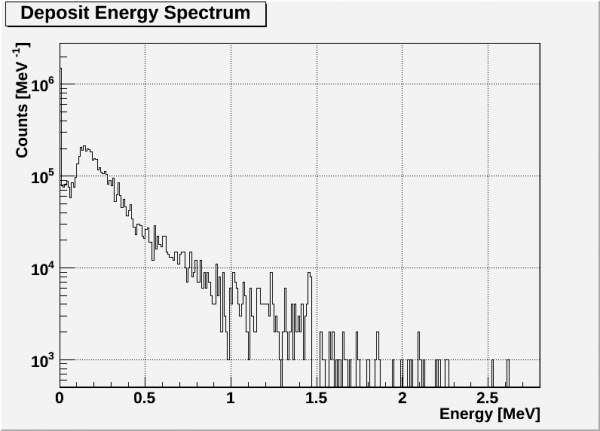
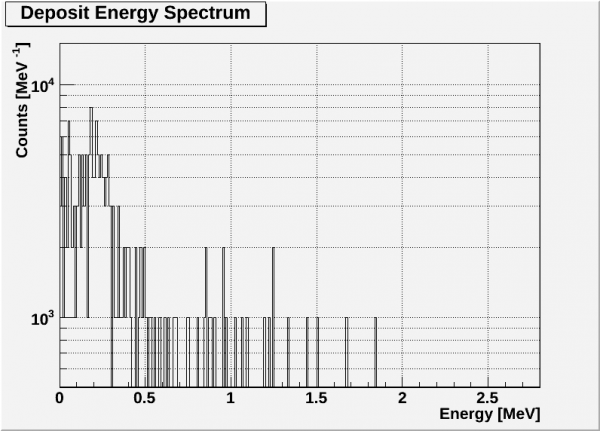
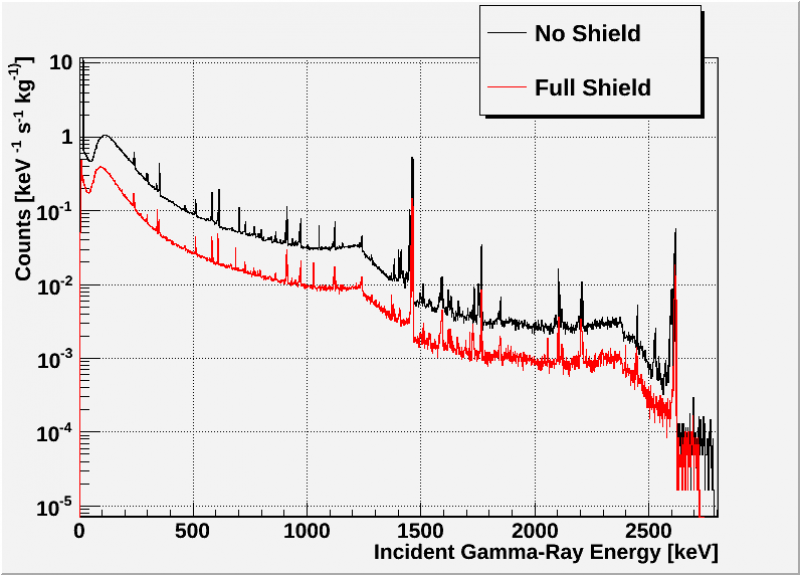
Figure 6 and 7 show the positions of events that hit the detector. Note that these are individual tracks and steps and thus multiple points could be the result of one event interacting with the detector repeatedly. Still, the number of points might be useful in comparing the inside of shield and outside of shield data. Figure 6 contains 16773 hits were energy has been deposited. Figure 7 contains 518. This suggests that the in shield geometry results in 32 times as many hits as the outside shield geometry. The outside shield's additional size and distances alone (not including the obstructing shield) results in the in shield geometry having an expected 5.1 times as many hits as the outside shield geometry. Therefore we can assume that the shield itself reduces the number of hits by 6.34. Our lab background tests shows that the shield actually reduces the energy spectra by roughly 3.5.
| Figure 6: Deposited Energy: Inside Shield |
|---|
 |
| Figure 7: Deposited Energy: Outside Shield |
|---|
 |
| Figure 8: Actual shield background data | |
|---|---|
 |  |
Update: 31/08/12
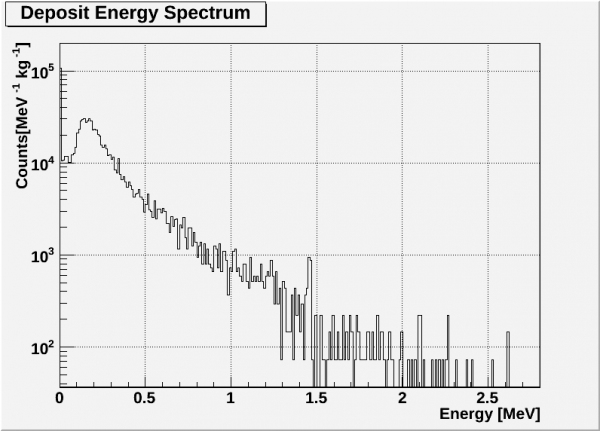
| Figure 9: Deposited Energy: Inside Shield |
|---|
 |
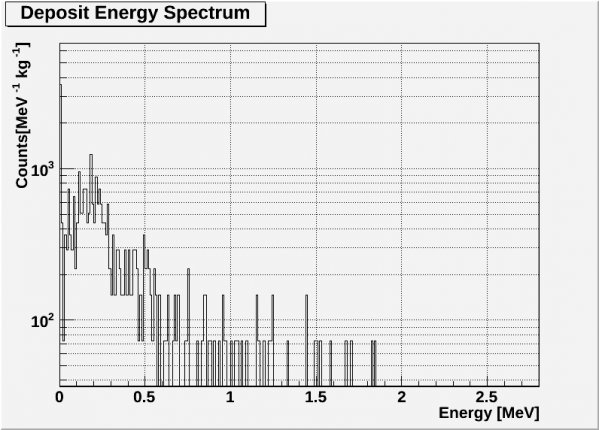
| Figure 10: Deposited Energy: Outside Shield |
|---|
 |