−Table of Contents
Long muon run with all PMTs
| Table 1: Data Files Used | |
|---|---|
| PMT | Data File |
| Middle | 1212-1217_attenuation_PMT14(middle)_1100v_1.5cm-dist.dat |
| Top | 1212-1217_attenuation_PMT18(top)_1100v_1.5cm-dist.dat |
| Bottom | 1212-1217_attenuation_PMT3(bottom)_1100v_1.5cm-dist.dat |
Energy Spectra
| Figure 1: Spectrum for the middle PMT. |
|---|
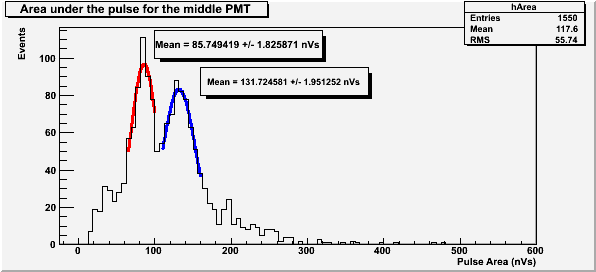 |
The average peak location at -1100V has been  .
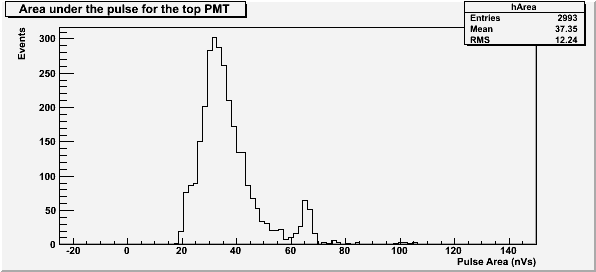
| Figure 2: Spectrum for the top PMT. |
|---|
 |
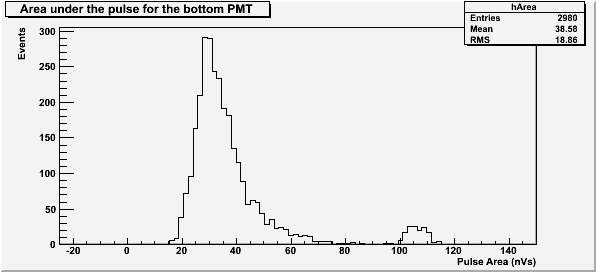
| Figure 3: Spectrum for the bottom PMT. |
|---|
 |
Timing Spectra
| Figure 4: Plot of time vs. pulse area for the middle PMT. |
|---|
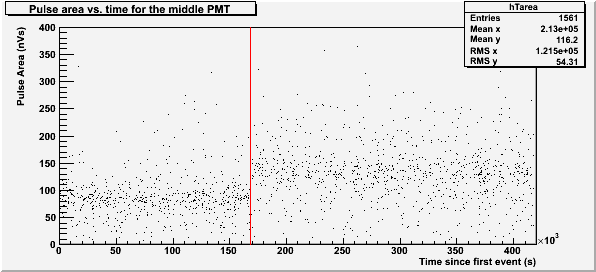 |
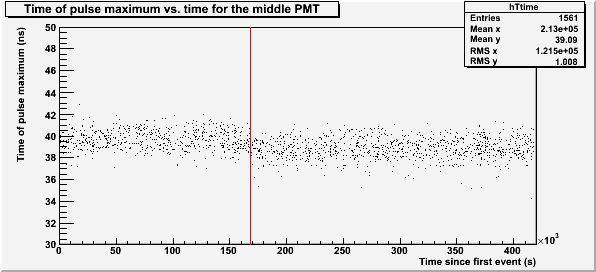
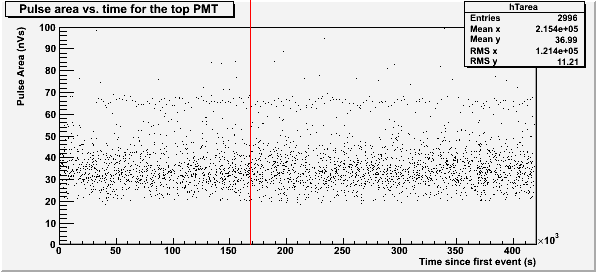
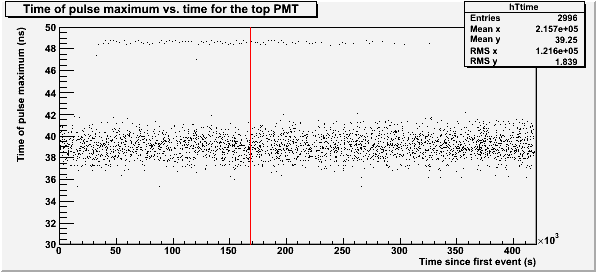
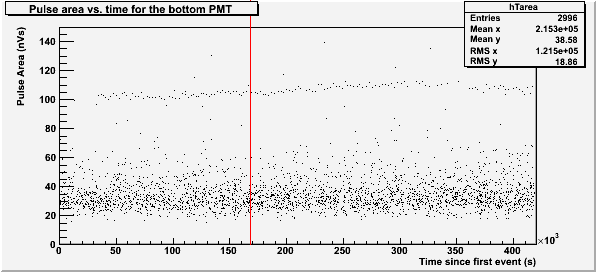
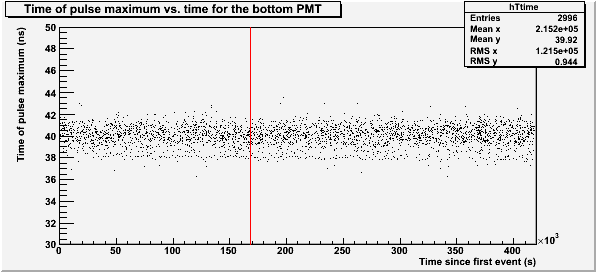
In this and all subsequent plots, the red line represents the time visible in this plot in which the gain of the middle PMT appears to have increased. This red line represents a time midway through Saturday (12/14/13 around 2:30 PM).
| Figure 5: Plot of time vs. timing of pulse maximum for the middle PMT. |
|---|
 |
| Figure 6: Plot of time vs. pulse area for the top PMT. |
|---|
 |
| Figure 7: Plot of time vs. timing of pulse maximum for the top PMT. |
|---|
 |
| Figure 8: Plot of time vs. pulse area for the bottom PMT. |
|---|
 |
| Figure 8: Plot of time vs. timing of pulse maximum for the bottom PMT. |
|---|
 |
Example Pulse
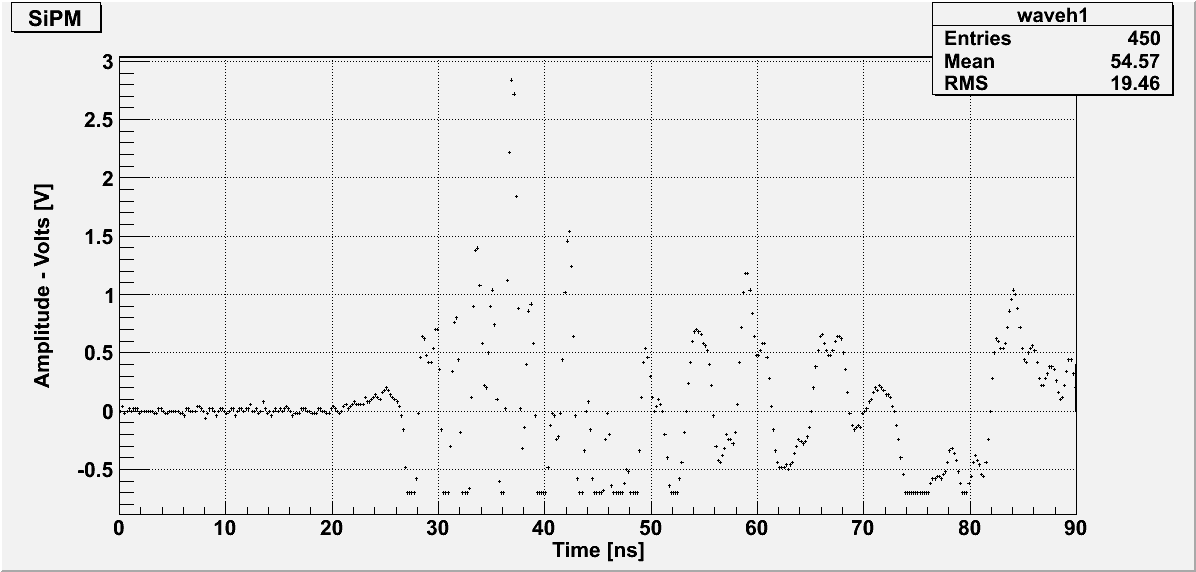
| Figure 10: An Example pulse from the Middle PMT after the possible gain increase showing ringing. |
|---|
 |
Comparison to atmospheric pressure
| Figure 11: Atmospheric pressure (and extraneous measurements of weather) in Minneapolis during the time of this run. |
|---|
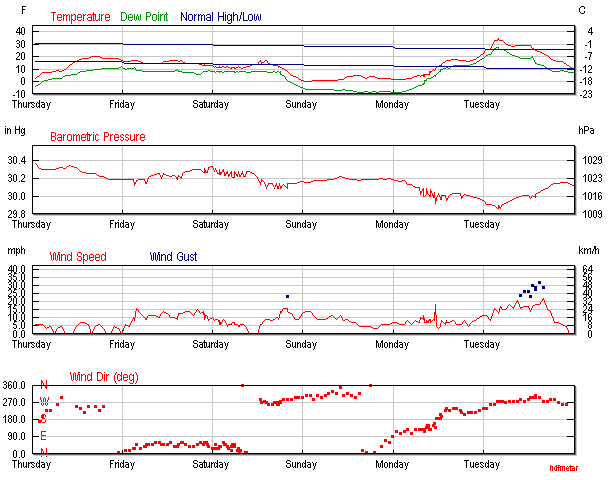 |
This figure is from wunderground (Their data is taken from NOAA.) from this website: http://www.wunderground.com/history/airport/KMSP/2013/12/12/CustomHistory.html?dayend=17&monthend=12&yearend=2013&req_city=NA&req_state=NA&req_statename=NA&MR=1
The jump in area occurred midway through Saturday (12/14/13 around 2:30 PM). The average pressure before the jump was about 102.6 kPa. The average pressure after the jump was about 101.95 kPa.
According to Wikipedia (http://en.wikipedia.org/wiki/Density_of_air), the density of air is
 ,
where P is pressure. R is constant, and T is assumed to be constant.
As described previously here, the energy of a muon through a substance is given by the equation
 ,
so the energy loss is given by
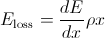 .
Therefore, the energy lost through the atmosphere at 102.6 kPa compared to 101.95 kPa is
 .
Assuming the energy the energy of the muons above the atmosphere is E0=6 GeV and the initial energy of the muons at the scintillator is 4 GeV, the initial energy loss through the atmosphere is 2 Gev. Therefore, the energy loss through the atmosphere at 101.95 kPa is 1.95 GeV.
The equation for energy lost through the scintillator is given by
 .
Therefore, the energy deposited in the scintillator at 102.6 kPa is 5.57 MeV and at 101.95 kPa is 5.58 MeV. This difference is negligible, so pressure change is not a likely cause of the jump in area. Further proof is that the energies of the muons in the top and bottom scintillators do not show this jump as well.
Re-scaled Energy Spectra
| Area under the pulse for the middle PMT with the second peak re-scaled to match the first peak. |
|---|
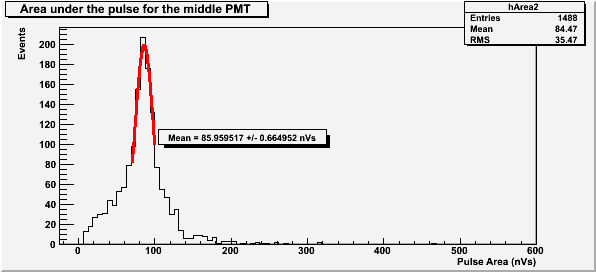 |
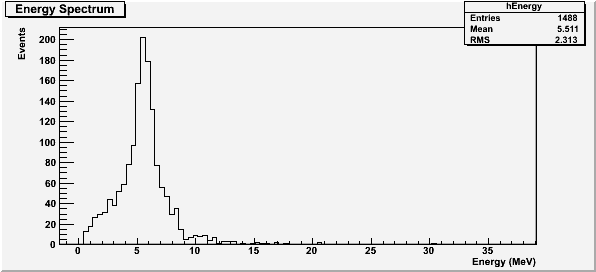
The gain increase occurred after approximately 1140 events. All events occurring after event number 1140 have been scaled by  so that the mean of the second peak matches the mean of the first peak.
| Re-scaled energy spectra for the middle PMT. |
|---|
 |