−Table of Contents
Looking for photoelectron peaks with all SiPMs
SiPM 1
SiPM 1 was placed in the dark-box with a blue LED with a 1.493 kOhm resistor. Each event was externally triggered with a 200 ms delay. There was a short run with 10k events (file: 130703_sipm1_blueled_delayed-trig_10hz_100ns_1.dat) and a long run with 100k events (file: 130704_sipm1_blueled_delayed-trig_10hz_100ns_x10.dat).
| Figure 1: SiPM 1 pulse area and maximums for each run. |
|---|
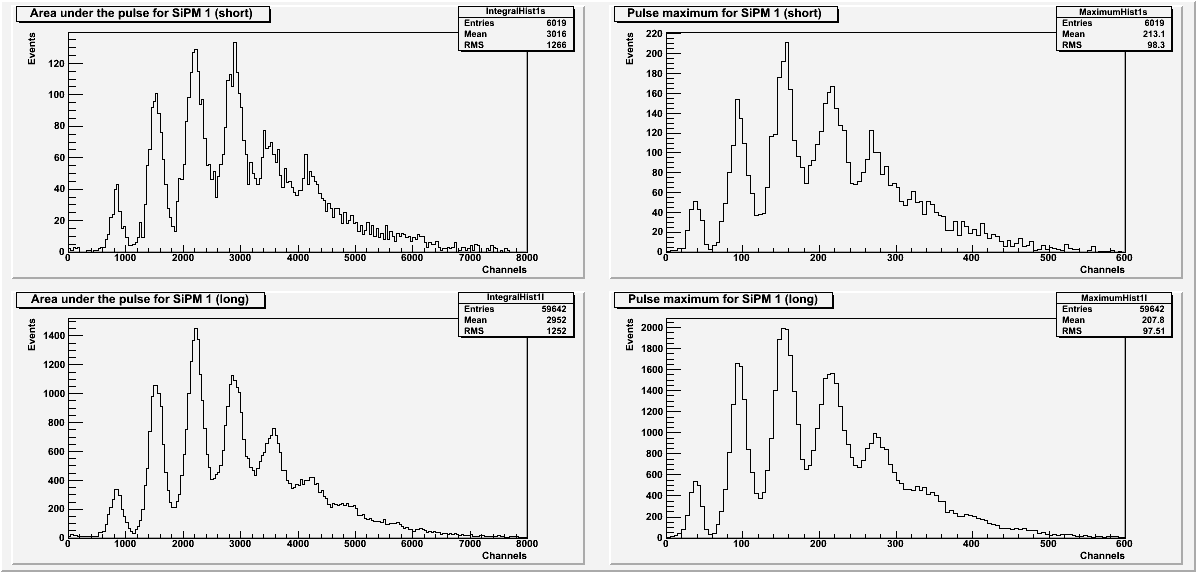 |
All histograms for SiPM 1 (Figure 1) exclude pulses with a baseline standard deviation greater than 22. The Pulse area histograms also exclude data with secondary pulses.
Photoelectron peaks are visible in all histograms for SiPM 1.
SiPM 2
SiPM 2 was placed in the dark-box with a blue LED with a 1.487 kOhm resistor. Each event was externally triggered with a 200 ms delay. There was one long run with 100k events (file: 130702_blueled_ext-trig_10hz_100ns_x10_2.dat).
| Figure 2: SiPM 2 pulse area and maximums. |
|---|
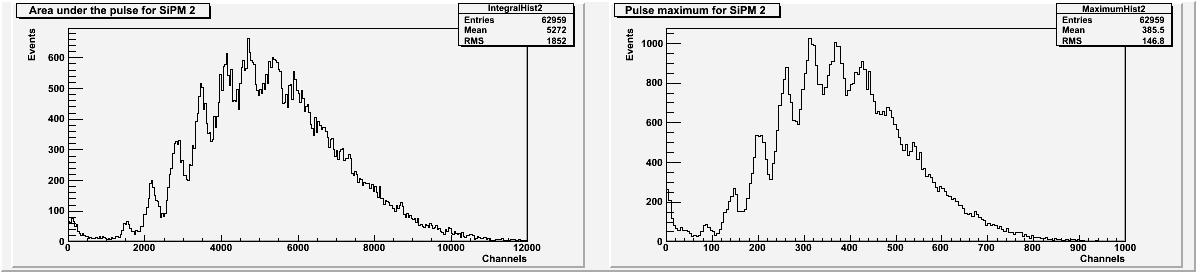 |
All histograms for SiPM 2 (Figure 2) exclude pulses with a baseline standard deviation greater than 25. The Pulse area histogram also excludes data with secondary pulses.
Photoelectron peaks are visible in both histograms for SiPM 2.
SiPM 3
SiPM 3 was placed in the dark-box with a blue LED with a 1.487 kOhm resistor. Each event was externally triggered. There was one long run with 100k events (file: 130628_blueLED_ext-trig_10hz_100ns_1.487kOhm_x10.dat). This data file was previously mentioned in the note Attempts to find photoelectron peaks under the heading “Changing to SiPM 3”.
| Figure 3: SiPM 3 pulse area and maximums. |
|---|
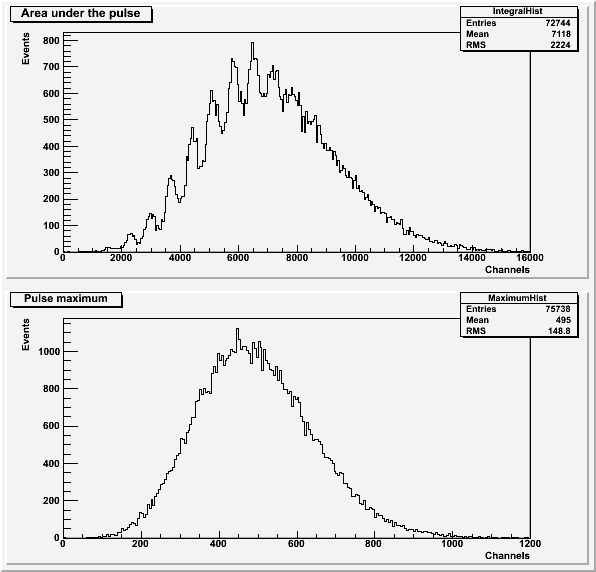 |
The histograms for the run with SiPM 3 (Figure 3) only include pulses with a baseline standard deviation less than 45. The pulse area histogram (Figure 3a) also does not include pulses with a secondary pulse present.
Photoelectron peaks are visible in the pulse area histogram in Figure 3.
SiPM 4
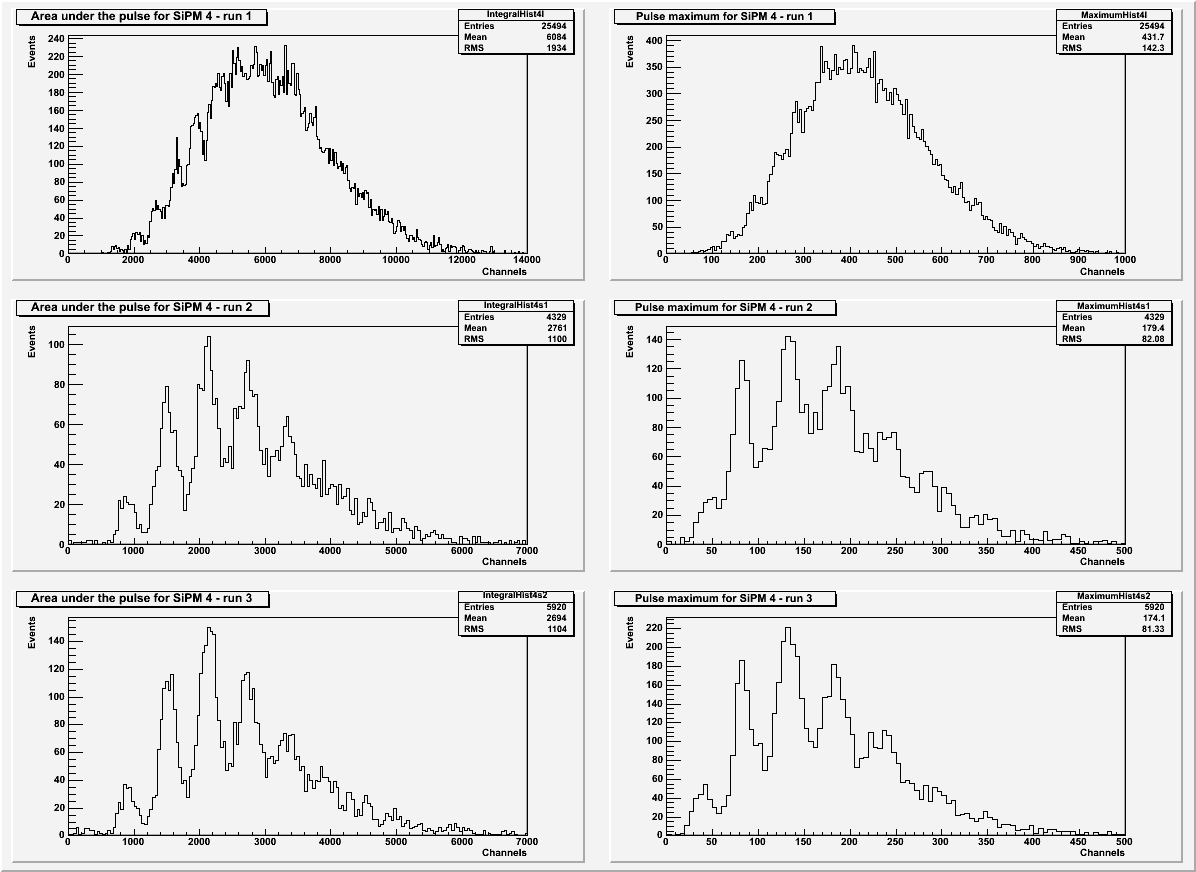
SiPM 4 was placed in the dark-box with a blue LED. Each event was externally triggered and delayed by 200 ms.
| Table 1: Explanation of the data files for SiPM 4. | |||
|---|---|---|---|
| Run | Number of events | Attenuation resistor | File |
| 1 | 100k | 1.493 kOhm | 130705_sipm4_blueled_delayed-trig_10hz_100ns_x10.dat |
| 2 | 10k | 1.568 kOhm | 130708_sipm4_blueled_delayed-trig_10hz_100ns.dat |
| 3 | 10k | 1.623 kOhm | 130708_sipm4_blueled_delayed-trig_10hz_100ns-2.dat |
| Figure 4: SiPM 4 pulse area and maximum for each run. |
|---|
 |
| Table 2: Cuts used for each run. | |
|---|---|
| Run | Baseline standard deviation. |
| 1 | 17 |
| 2 | 20 |
| 3 | 23 |
All histograms for SiPM 2 (Figure 2) exclude pulses with a baseline standard deviation greater than what is listed in Table 2. The Pulse area histograms also exclude events with secondary pulses
Photoelectron peaks are visible in all histograms for SiPM 4. The peaks are clearer when a higher resistor is used.