−Table of Contents
Attempts to find photoelectron peaks
Higher Resistor Test
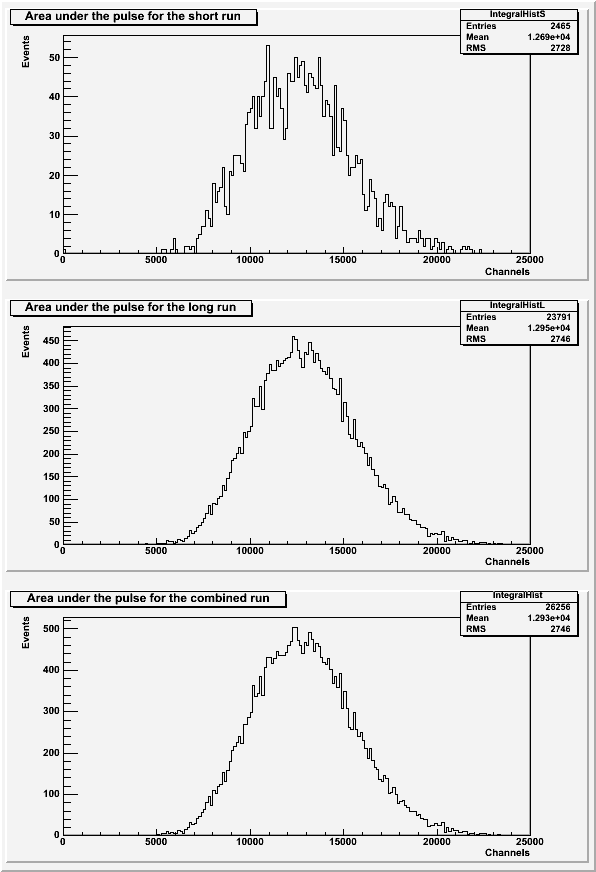
SiPM 4 and a blue LED were tested with a 1.487kOhm resistor in the dark-box in order to see if a lower light intensity would allow the photoelectron peaks to be resolved. There are two runs that are identical except for the number of events taken. Data file 130626_blueLED_ext-trig_10Hz_100ns_1.487kOhm.dat has 10k events (short), and 130626_blueLED_ext-trig_10Hz_100ns_1.487kOhm_x10.dat has 100k events (long). Both runs are externally triggered.
| Figure 1: The area under the pulse for each run individually and combined. |
|---|
 |
| Figure 2: The pulse maximums for each run individually and combined. |
|---|
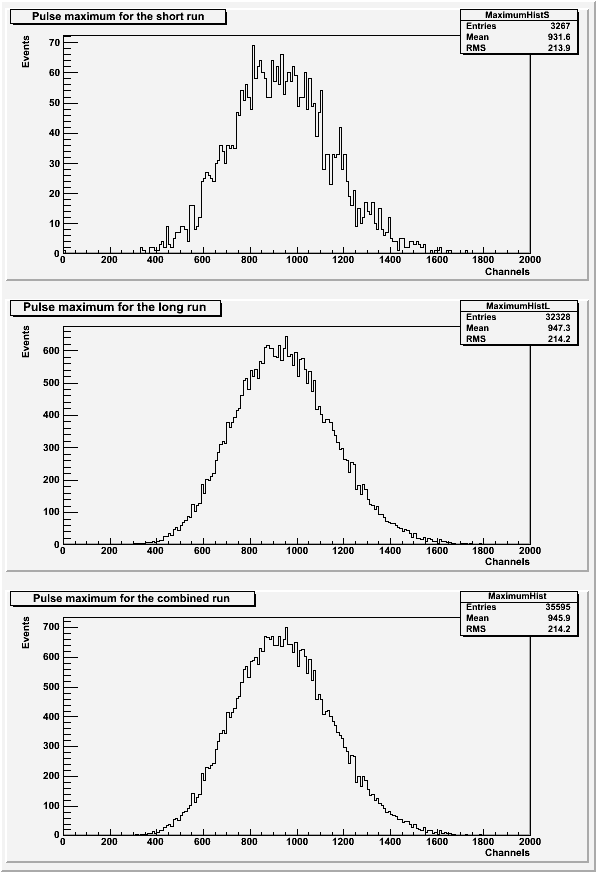 |
The histograms of the pulse areas (Figure 1) only used pulses with a baseline standard deviation less than 43 and no secondary pulses present. The histograms of the pulse maximums (Figure 2) only used pulses with a baseline standard deviation less than 43.
The photoelectron peaks are still not present in either set of histograms.
Higher Gain (Bias Voltage) Test
Another attempt to resolve photoelectron peaks was conducted with a higher gain. The bias voltage on SiPM 4 was raised from 20.6V to 21.5V. This should increase the channel-separation between photoelectron peaks. This test was conduced using a blue LED with a 1.487 kOhm resistor in the dark-box. The SiPM was externally triggered and had 100k events. The data file for this run is 130627_blueLED_ext-trig_10hz_100ns_x10_bias3800.dat.
| Figure 3: The pulse area and maximum for the higher bias voltage run. |
|---|
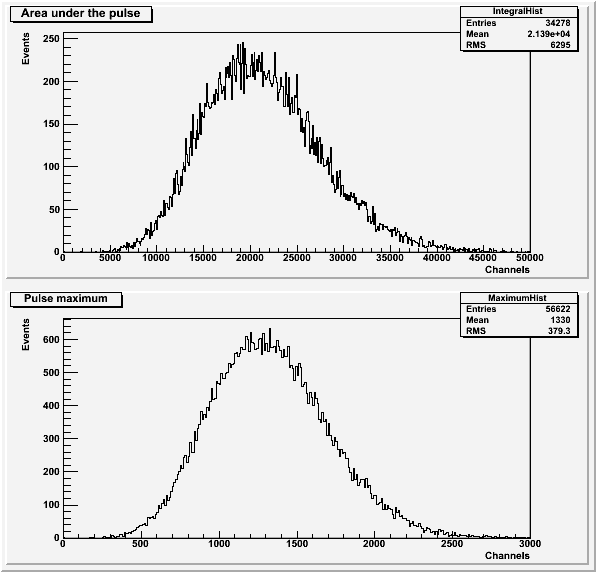 |
The histograms for the run with the higher bias voltage (Figure 3) only include pulses with a baseline standard deviation less than 53. The pulse area histogram (Figure 3a) also does not include pulses with a secondary pulse present.
The photoelectron peaks are still not present in this set of histograms.
Changing to SiPM3
A third attempt to resolve photoelectron peaks was done by changing SiPMs. SiPM 3 was run with the bias voltage back at 20.6V and with the blue LED with a 1.487 kOhm resistor in the dark box. This run was externally triggered and had 100k events. The data file for this run is 130628_blueLED_ext-trig_10hz_100ns_1.487kOhm_x10.dat.
| Figure 4: The pulse area and maximum for SiPM 3. |
|---|
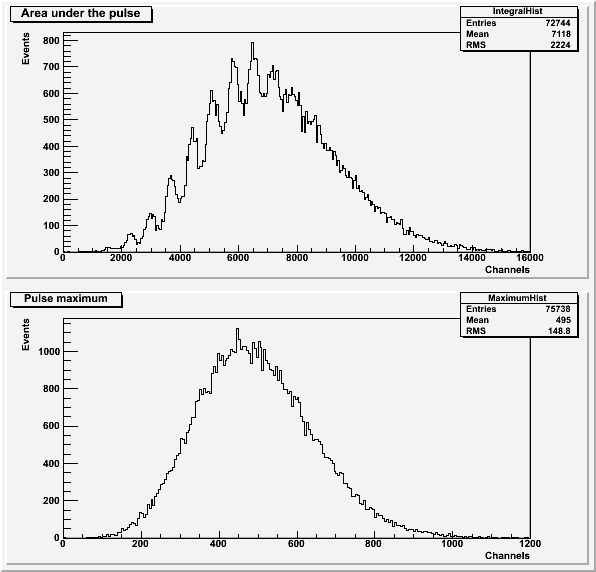 |
The histograms for the run with SiPM 3 (Figure 4) only include pulses with a baseline standard deviation less than 45. The pulse area histogram (Figure 4a) also does not include pulses with a secondary pulse present.
This run was successful because photoelectron peaks are visible in the histogram of the pulse area (Figure 4a).