−Table of Contents
Test with two SiPM
Histogram Comparisons
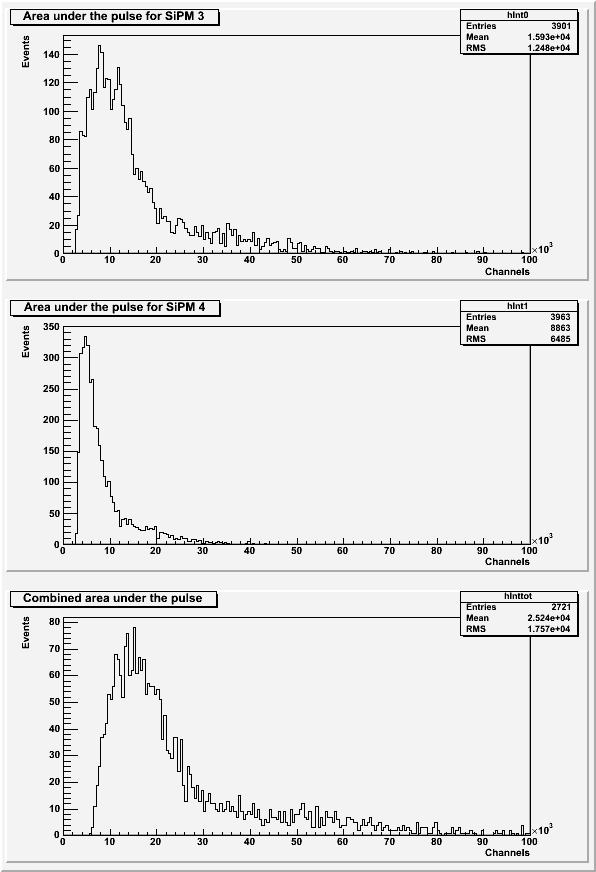
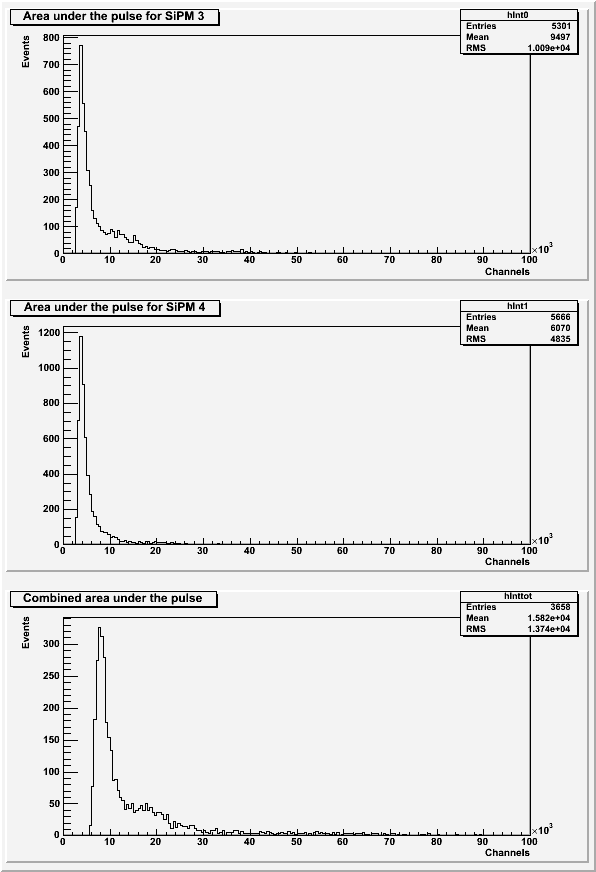
SiPM 3 and SiPM 4 were placed in their delrin holders on opposite ends of scintillator 1-74-1 (with the wavelength shifting fiber) in the darkroom. Each event was self-triggered when both SiPMs passed a trigger threshold of 8400.
| Table 1: Further run information. | |||
|---|---|---|---|
| Run | Number of Events | Source | Data file |
| 1 | 6.9K | no source (background) | 130718_sipm3+4_background_8400threshold.dat |
| 2 | 10k | Ba-133 (3 cm from crystal) | 130718_sipm3+4_ba-133_8400threshold.dat |
| 3 | 10k | Ba-133 (1 cm from crystal) | 130719_sipm3+4_ba-133_8400threshold.dat |
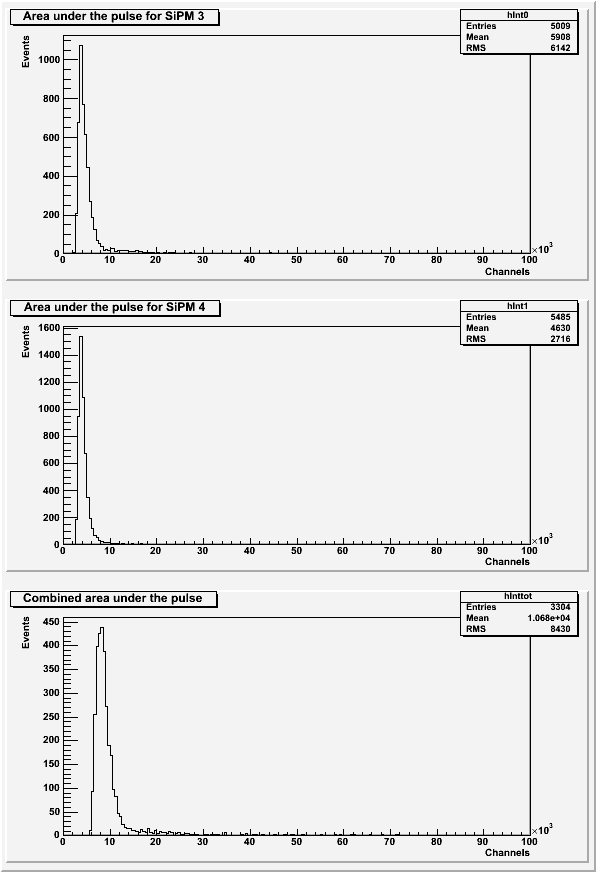
| Figure 1: Area under the pulse for the background run for SiPM 3 only, SiPM 4 only, and combined. |
|---|
 |
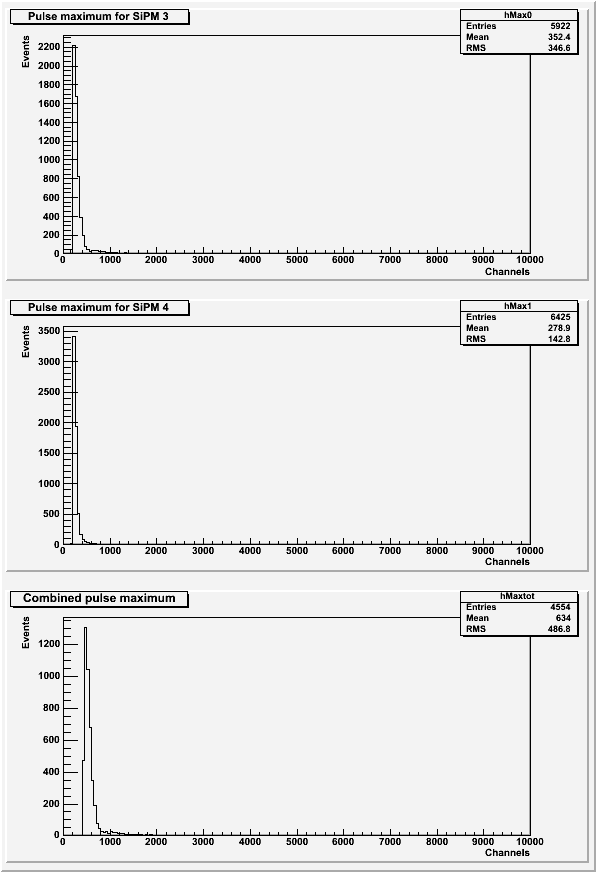
| Figure 2: Pulse maximum for the background run for SiPM 3 only, SiPM 4 only, and combined. |
|---|
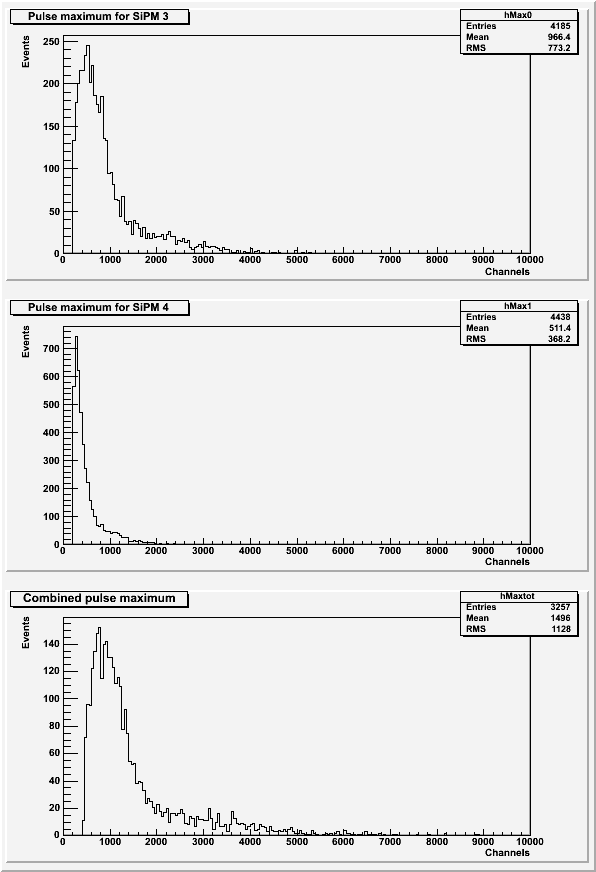 |
All histograms above (Figures 1 and 2) exclude pulses with a baseline standard deviation greater than 7. The pulse area histograms (Figure 1) also excludes data with secondary pulses present.
| Figure 3: Area under the pulse for the Ba-133 run for SiPM 3 only, SiPM 4 only, and combined. |
|---|
 |
| Figure 4: Pulse maximum for the Ba-133 run for SiPM 3 only, SiPM 4 only, and combined. |
|---|
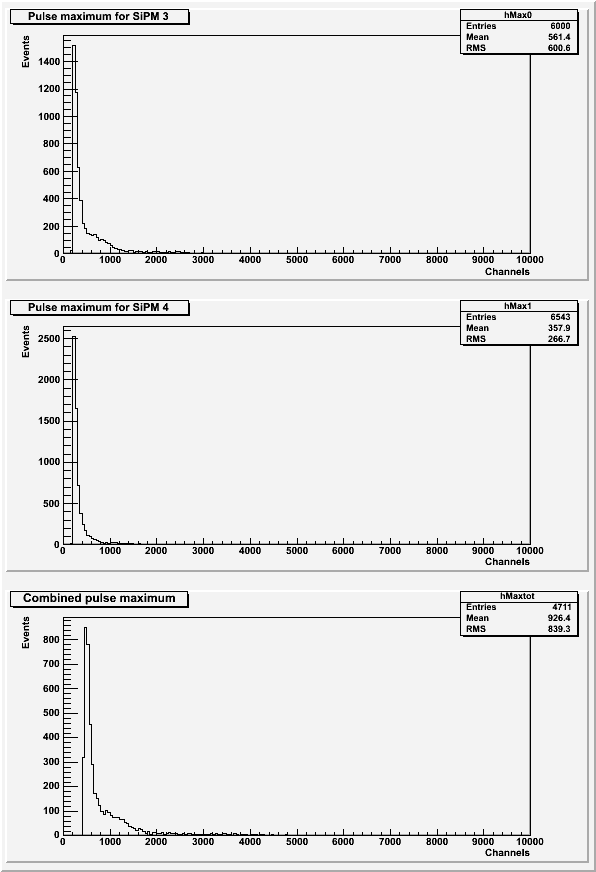 |
All histograms above (Figures 3 and 4) exclude pulses with a baseline standard deviation greater than 7. The pulse area histograms (Figure 3) also excludes data with secondary pulses present.
| Figure 5: Area under the pulse for the closer Ba-133 run for SiPM 3 only, SiPM 4 only, and combined. |
|---|
 |
| Figure 6: Pulse maximum for the closer Ba-133 run for SiPM 3 only, SiPM 4 only, and combined. |
|---|
 |
All histograms above (Figures 5 and 6) exclude pulses with a baseline standard deviation greater than 7. The pulse area histograms (Figure 5) also excludes data with secondary pulses present.
| Figure 7: Comparison of area under the pulse for each run. |
|---|
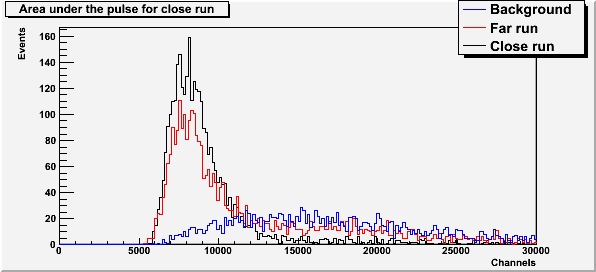 |
Therefore, we think the second peak visible in the far run is background, and the main peak in the far and close runs are the Ba-133 peak.
Gain Matching
As seen in the comparison between SiPMs, each SiPM 3 and SiPM 4 have different gains. In order to add the pulses from these two SiPMs together, the data collected from SiPM 4 must be corrected to have the same gain as SiPM 3.
Data from the following runs were used (from Comparison of all four SiPM - Long Runs):
130709_sipm3_blueled_delayed-trig_10hz_100ns_x10_1.806kohm.dat
130710_sipm4_blueled_delayed-trig_10hz_100ns_x10_1.806kohm.dat
| Figure 8: Gaussian fits to each pulse area photoelectron peak for SiPM 3 and SiPM 4. |
|---|
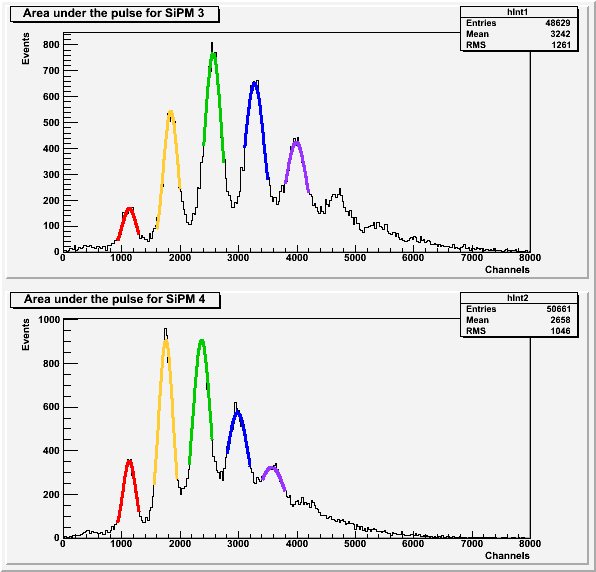 |
The average difference between the location of subsequent photoelectron peaks for SiPM 3 is 714.207 and for SiPM 4 is 608.911. Therefore, the gain correction for the area under the pulse of SiPM 4 is 1.1728.
| Figure 9: Gaussian fits to each pulse maximum photoelecton peak for SiPM 3 and SiPM 4. |
|---|
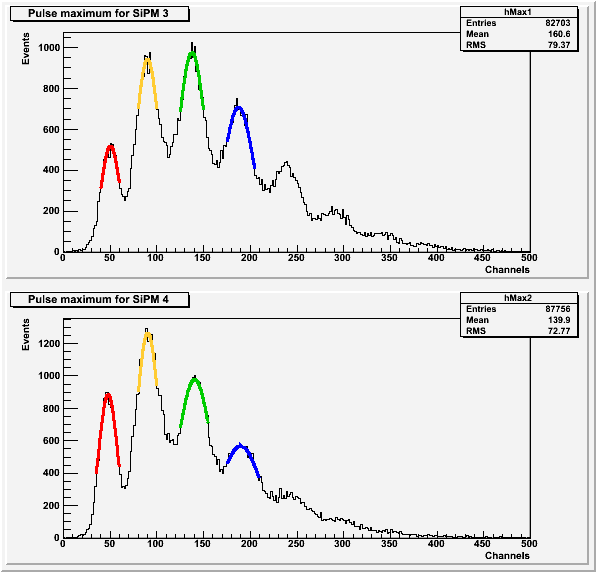 |
The average difference between the location of subsequent photoelectron peaks for SiPM 3 is 45.6952 and for SiPM 4 is 47.233. Therefore, the gain correction for the pulse maximum of SiPM 4 is 0.9674.
All histograms above (Figures 1 and 2) exclude data with a baseline standard deviation greater than 27. The histograms of the pulse areas (Figure 1) also excludes data with secondary pulses.