Various Monochromator Measurements
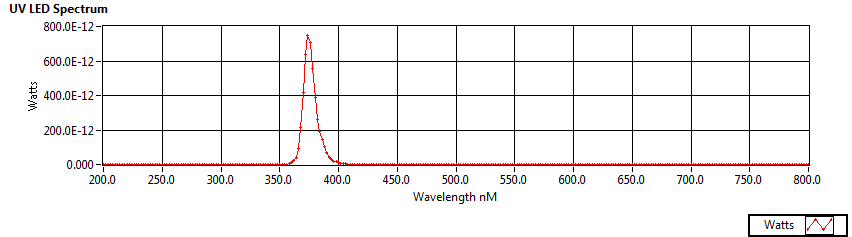
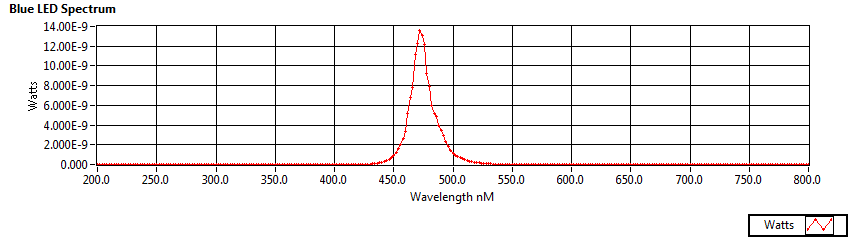
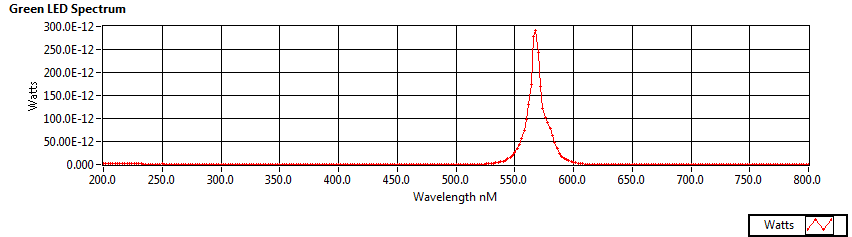
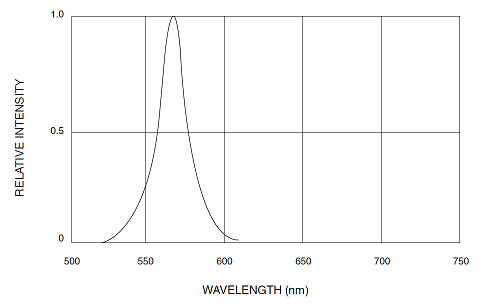
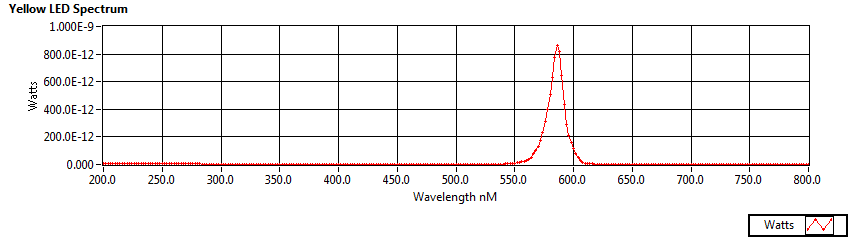
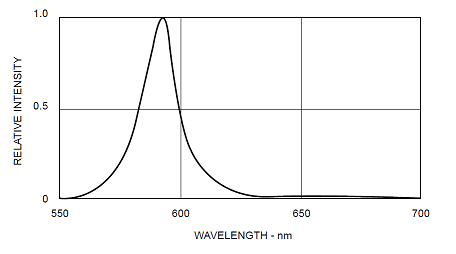
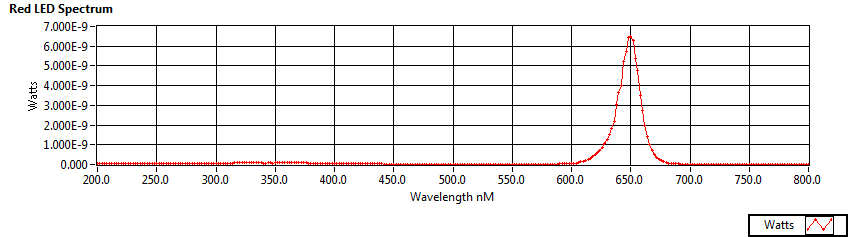
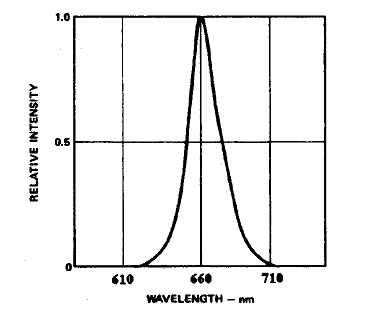
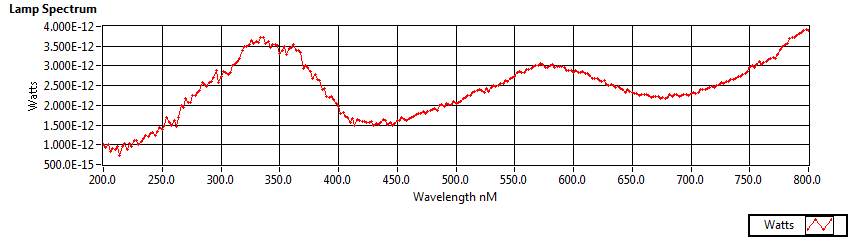
Update: power density spectra for LEDs
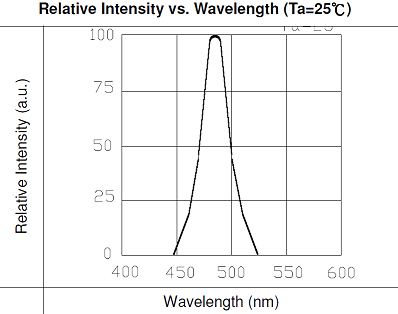
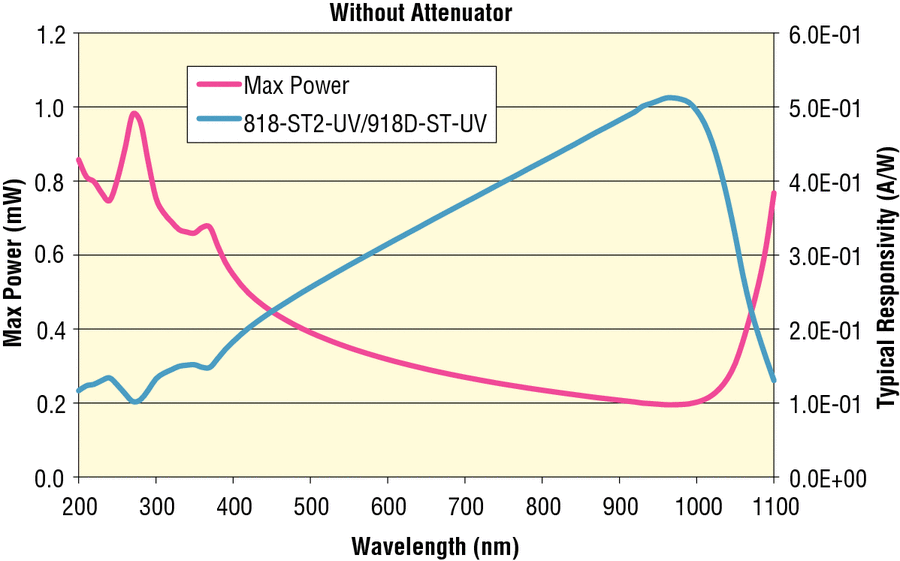
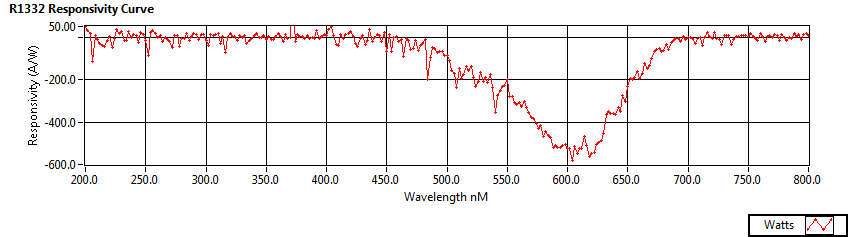
PMT R1332 Responsivity Curve
Scintillator Sample Emission Spectrum
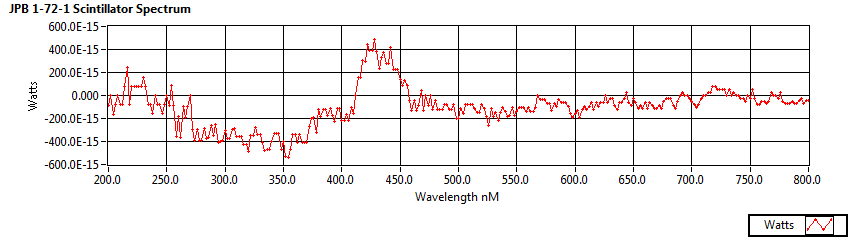
The UV LED whose spectra is shown in figure 2 is used to illuminate a polystyrene sample (JPB 1-72-1) doped with wavelength shifters PPO and POPOP. The sample is placed just outside the input to the monochromator so its emission spectrum can be measured. The resulting spectrum is seen in figure 10. Compared to the LED spectra, the scintillator is dimmer and its light is emitted isotropically, so the measured spectrum has a much lower total power. A possible peak from POPOP emission can be seen between 400 and 450 nm, whereas no peak can be seen in PPO's emission band between 325 and 410 nm. The UV LED's emission spectrum falls within the absorption region of POPOP but not PPO, perhaps explaining the missing PPO peak.
| Figure 10: JPB 1-72-1 emission spectrum |
 |
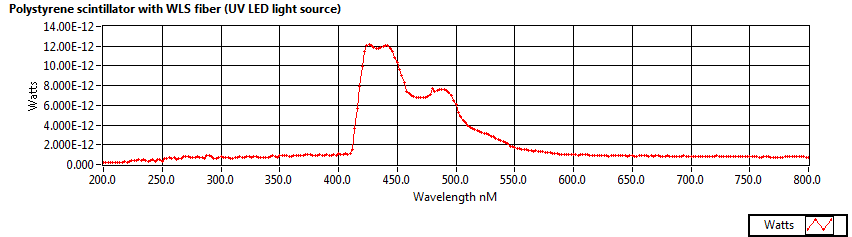
A different sample with a blue-to-green wavelength shifting fiber in its center is machined so that a UV LED can be embedded in the scintillating material. Two spectra are measured, one shown in figure 11 with both the WLS fiber and scintillator light entering the monochromator, and another shown in figure 12 with only the WLS fiber light entering the monochromator.
| Figure 11 |
 |
| Figure 12 |
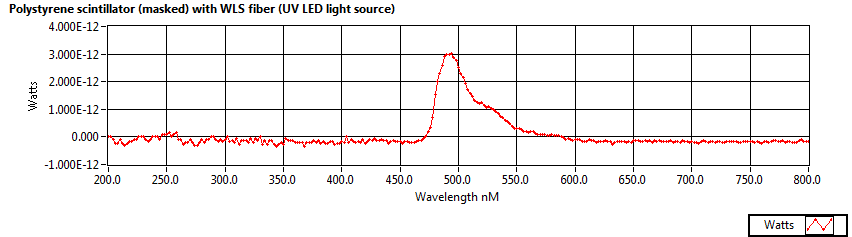 |
The WLS fiber has a peak emission wavelength of 494 nm, and this matches the peak seen in figure 12. The expected POPOP emission spectrum is more complicated, but it is concentrated around 375-450 nm, which generally agrees with our observation.
Scintillator Masked/Unmasked Comparison
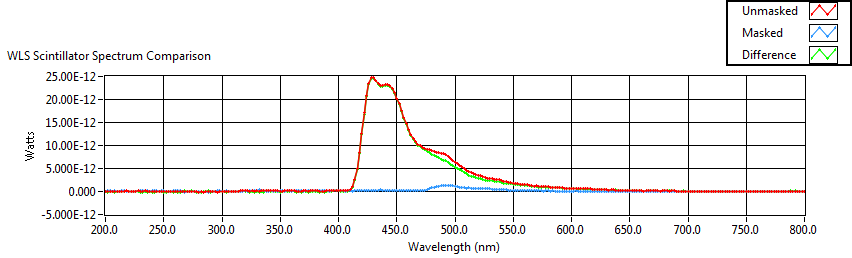
The same scintillator sample with embedded WLS fiber is held in a fixed position in order to directly compare unmasked and unmasked sample spectra. The sample position between runs is maintained by aligning the WLS fiber with two crossed laser beams held by a ring stand. The results are given in figure 13 along with the difference between the masked (fiber-only) and unmasked (entire sample) spectra.
| Figure 13 |
 |
Trapping Fraction:
If we approximate the area under the “masked” and “difference” curves in figure 13 with Riemann sums, we find that the masked-difference ratio of the areas is 0.0667, i.e. an energy loss of 93.33%. Previous estimates put the energy loss from scintillator to fiber at 68.3 ± 5.0%, but the previous method relied on a PMT with unknown window material / quantum efficiency.