Barium-133, Americium-241, and Cobolt-57 spectra
PMT 14 was run with a bias voltage of -1100 V with scintillator 1-66-? and varying sources in the darkroom. Each event was self-triggered with a trigger threshold of 8280 for a total of 100k events.
| Table 1: Data files used. |
| Run | Source | Source Distance | Data file |
| 1 | background | N/A | 130826_pmt14_background_8280_1100v_x10.dat |
| 2 | barium-133 | outside black-box | 130823_pmt14_ba133_8280_1100v_x10.dat |
| 3 | barium-133 | 2 cm | 130826_pmt14_ba133_8280_1100v_x10.dat |
| 4 | americium-241 | 10 cm | 130823_pmt14_am241_8280_1100v_x10.dat |
| 5 | americium-241 | 2 cm | 130826_pmt14_am241_8280_1100v_x10.dat |
| 6 | cobolt-57 | against plastic | 130827_pmt14_co57_8280_1100v_x10.dat |
DAQ Saturation
From a previous calculation, the DAQ is known to saturate at around 4500 channels for the pulse amplitude. The plot below shows the equivalent for pulse area. All runs are used to create this plot. All pulses with a baseline standard deviation greater than 8 are excluded from this plot.
| Figure 1: Pulse amplitude vs. area. |
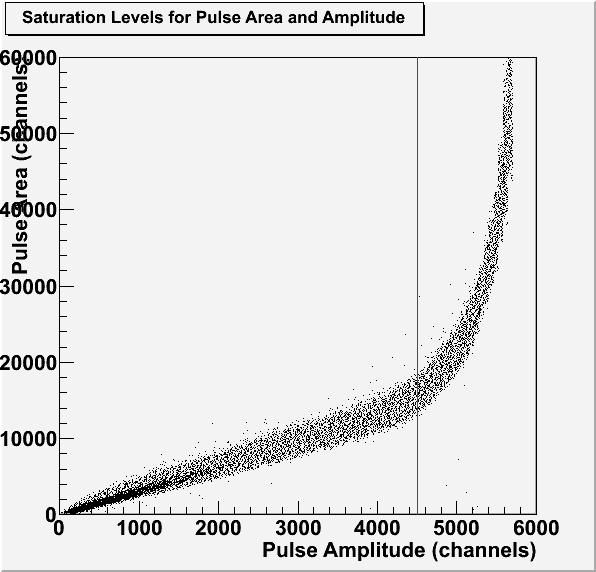 |
The red line represents the 4500 channel maximum for the pulse amplitude. All subsequent histograms cut any pulses for which the amplitude was greater than 4500 channels.
Background
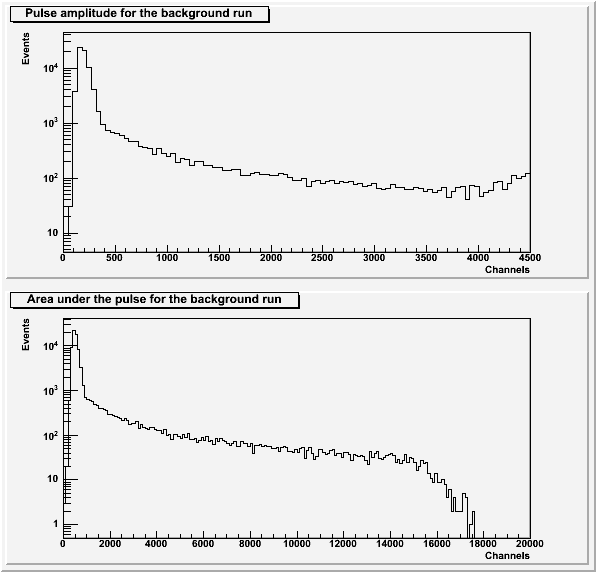
The histograms in Figure 2 exclude any pulses with a baseline standard deviation greater than 8. The pulse area histogram also excludes pulses with a secondary pulse present before the main pulse.
| Figure 2: Pulse maximum and area for the background run. |
 |
Barium-133
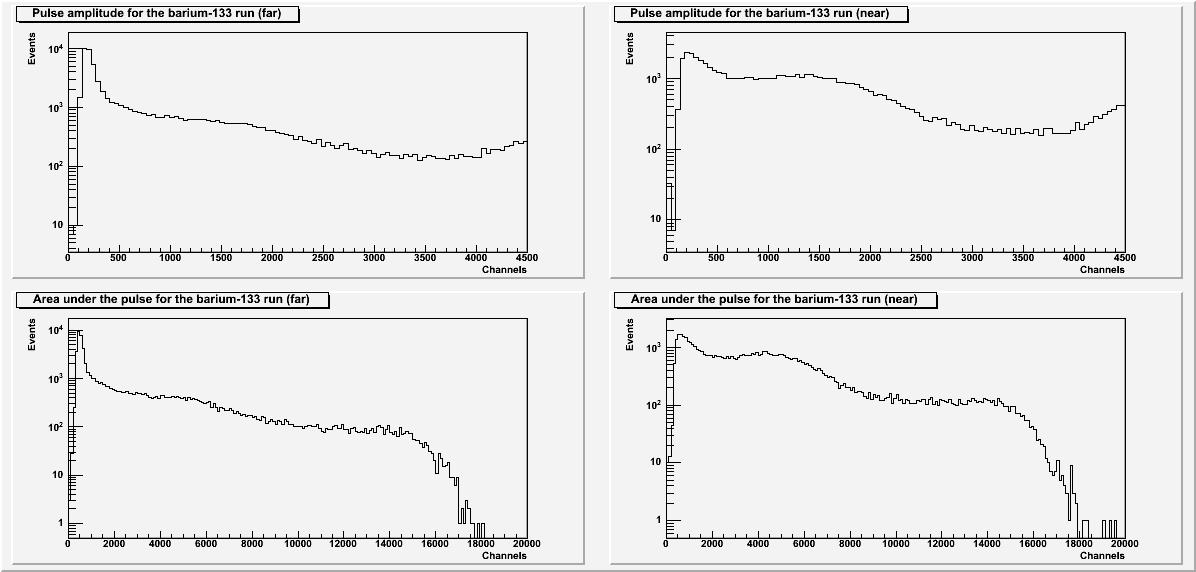
The histograms in Figure 3 exclude any pulses with a baseline standard deviation greater than 8. The pulse area histograms also exclude pulses with a secondary pulse present before the main pulse.
| Figure 3: Pulse maximum and area for Barium-133 runs. |
 |
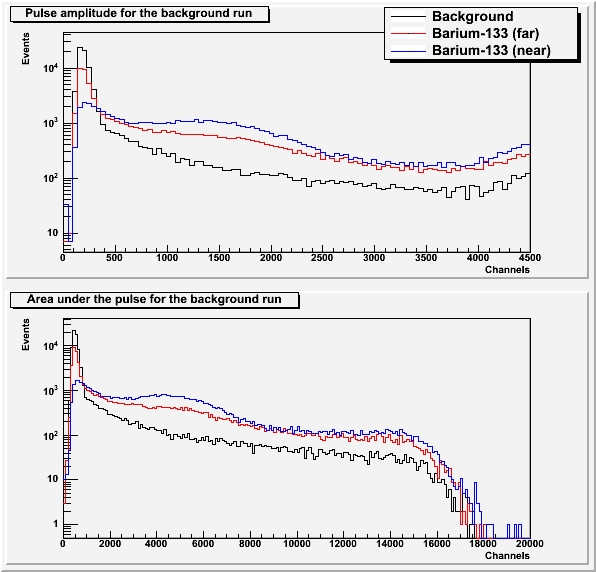
| Figure 4: Comparison of Barium-133 runs to background. |
 |
Americium-241
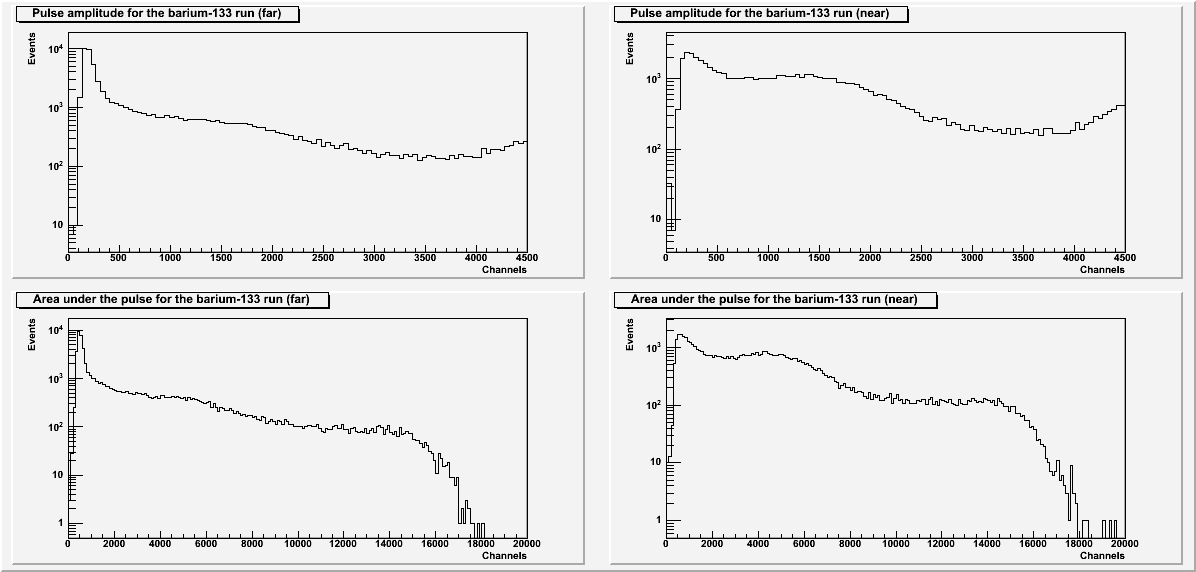
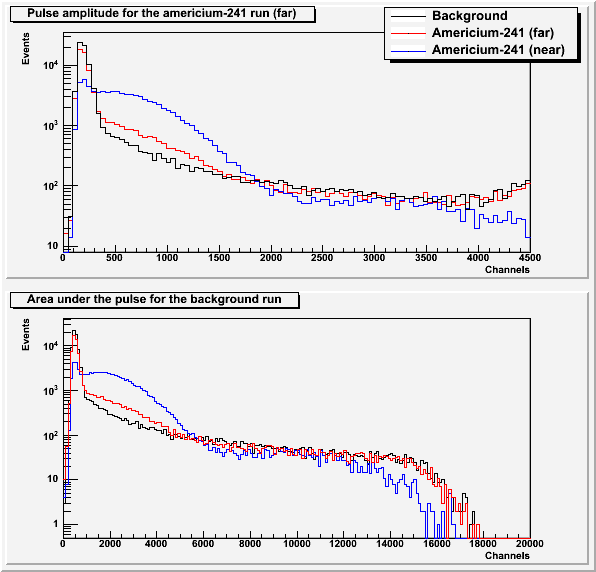
The histograms in Figure 5 exclude any pulses with a baseline standard deviation greater than 8. The pulse area histograms also exclude pulses with a secondary pulse present before the main pulse.
| Figure 5: Pulse maximum and area for Americium-241 runs. |
 |
| Figure 6: Comparison of Americium-241 runs to background. |
 |
Cobolt-57
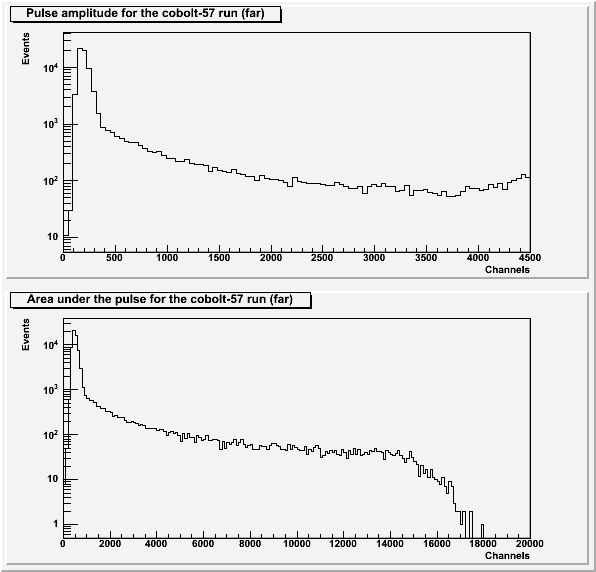
The histograms in Figure 7 exclude any pulses with a baseline standard deviation greater than 8. The pulse area histograms also exclude pulses with a secondary pulse present before the main pulse.
| Figure 7: Pulse maximum and area for Cobolt-57 run. |
 |
| Figure 6: Comparison of Cobolt-57 run to background. |
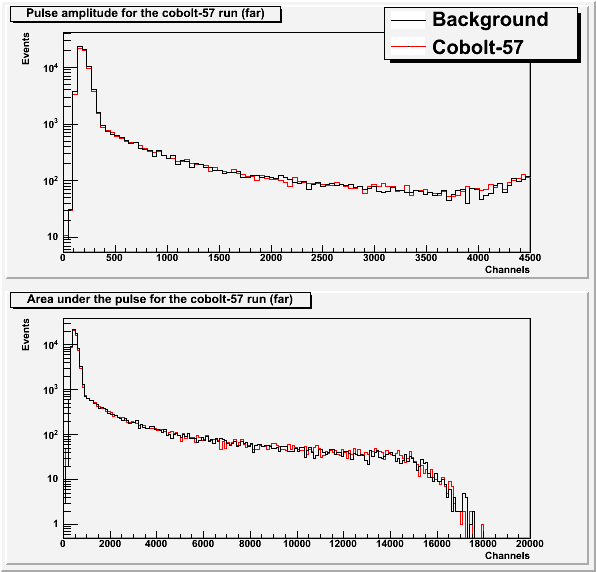 |
The cobolt-57 source is depleted.