−Table of Contents
Searching for PMT Single Photoelectron Peaks
Thorn-EMI 9133KFLB PMTs are attached in the place of SiPMs on the DAQ board and are biased at varying voltages. We attempt to find the typical pulse integral and pulse maximum for single photoelectron events.
Four PMTs are used in total, differentiated by the number printed on the body of the tube.
Initial self-trigger test of PMT 14
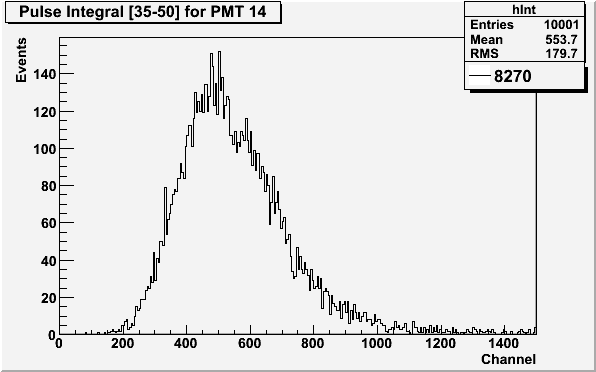
PMT 14 is wrapped in felt in the darkroom and biased to 1100V. The events are self-triggered at a threshold of 8270, and no light source is added. The pulse maximum histogram cuts all events with a baseline standard deviation greater than 15.
| Figure 1.1: Pulse integral and pulse maximum histograms for PMT 14 |
|---|
 |
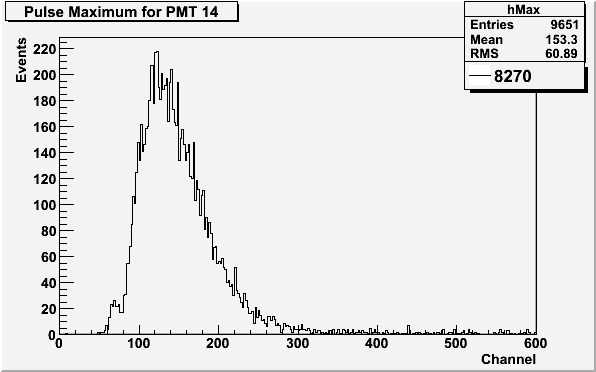 |
A slight dip can be observed just to the left of the integral maximum, and a secondary peak can be observed to the left of both histogram maximums, but the significance of either is uncertain.
PMT 14 at varying self-trigger thresholds
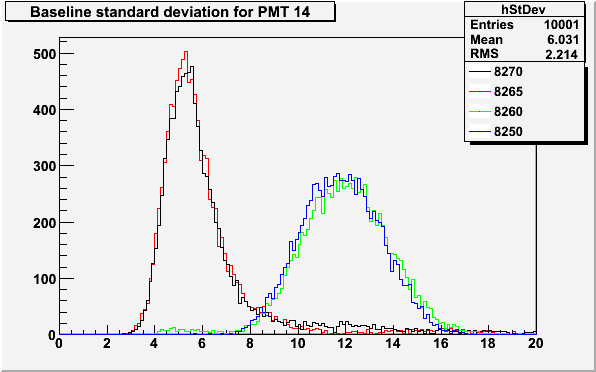
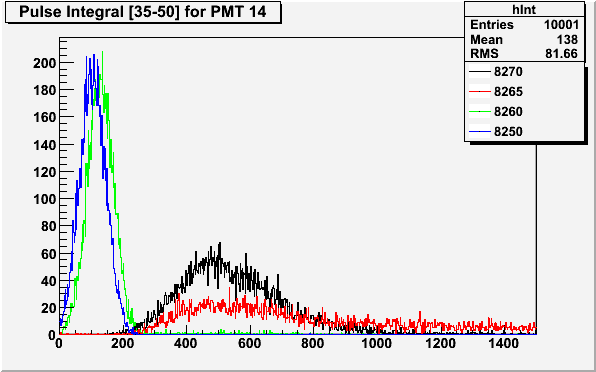
PMT 14 is used again to determine whether the previous trigger threshold of 8270 is too high (cutting off the single p.e. peak) or too low (allowing noise to dominate the recorded events). A bias of 1100V is again applied.
| Figure 2.1: Baseline deviation, Integral and Maximum histograms at varying thresholds |
|---|
 |
 |
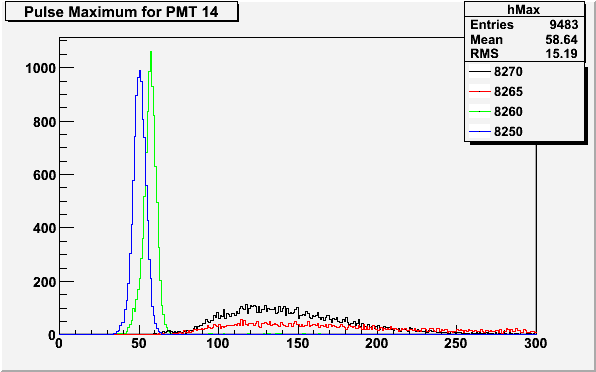 |
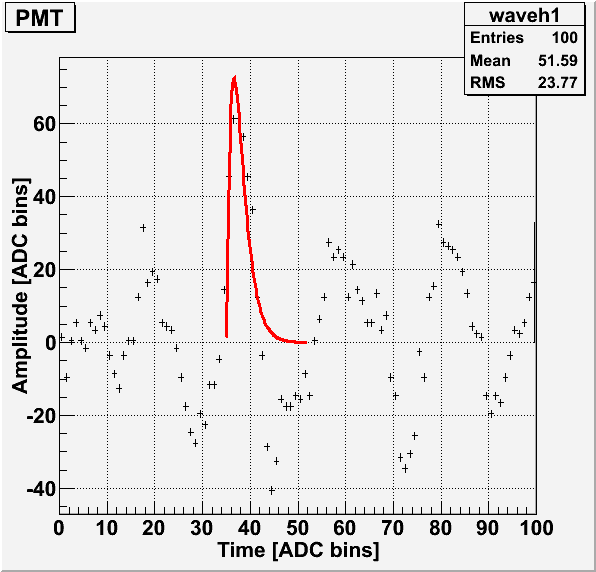
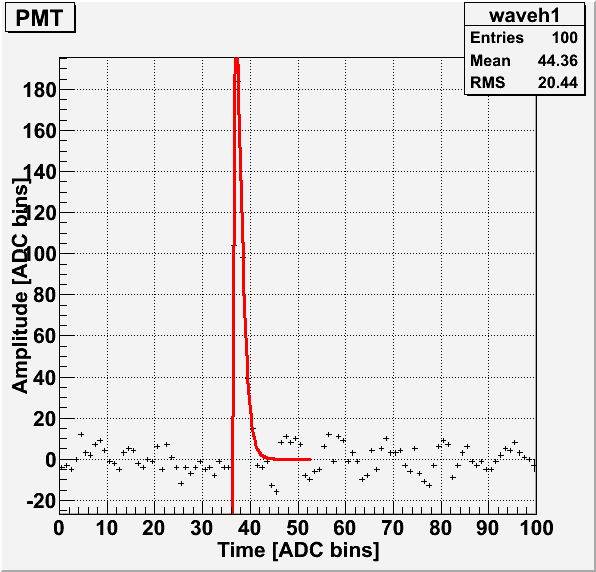
We see that between a threshold of 8260 and 8265, a transition occurs where the baseline standard deviation drops and the pulse maximum rises. This difference can be seen in figures 3 and 4 below. In figure 3 (8260 threshold) we see a pulse with baseline varying between ±30, while in figure 4 (8270 threshold) the baseline varies between ±15 and the fitted pulse is more in line with a typical PMT pulse.
| Figure 2.2: Typical pulse for PMT 14 at 8260 threshold |
|---|
 |
| Figure 4: Typical pulse for PMT 14 at 8270 threshold |
 |
PMT 14 external trigger w/ blue LED
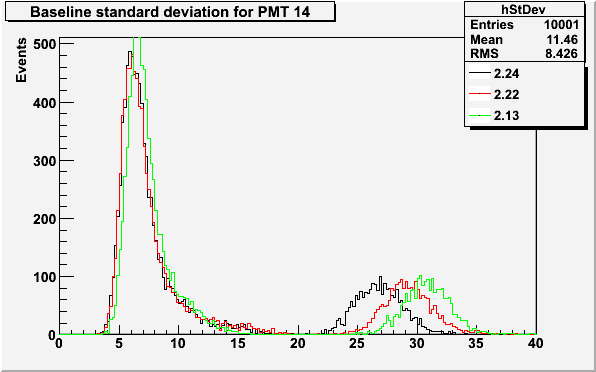
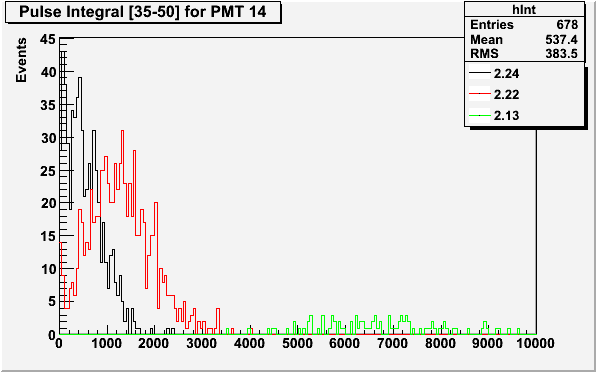
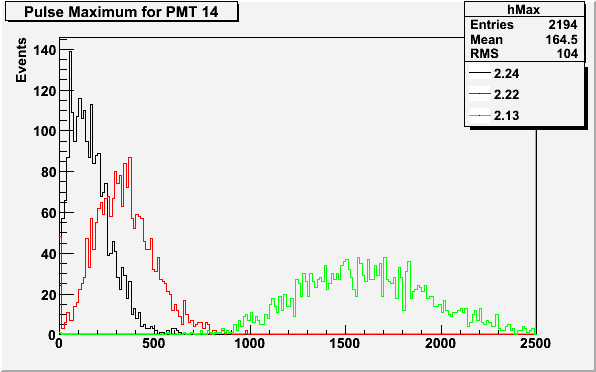
PMT 14 is set up in a similar manner to this SiPM run where an external trigger was used in conjunction with a blue LED. PMT 14 is biased to 1100v its window is faced towards the LED, and 3 data runs are taken using varying LED resistances. We observe a double peak in the standard deviation histogram; the pulse integral and maximum histograms are cut to only include events with a baseline standard deviation below 20.
| Figure 3.1: PMT 14 external trigger histograms |
|---|
 |
 |
 |
PMT+DAQ noise characterization
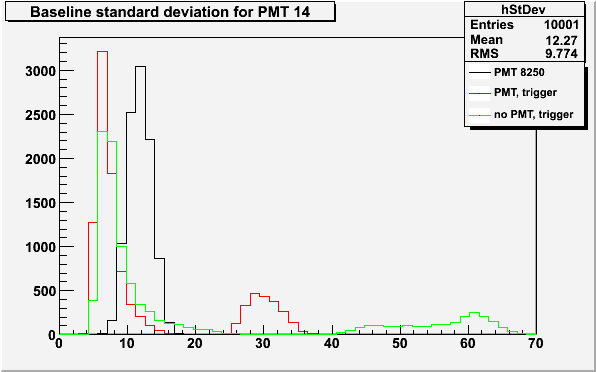
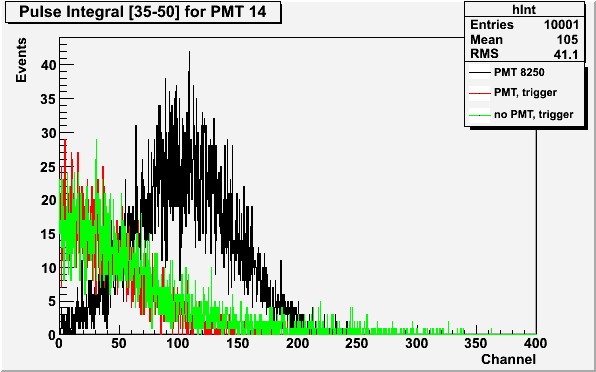
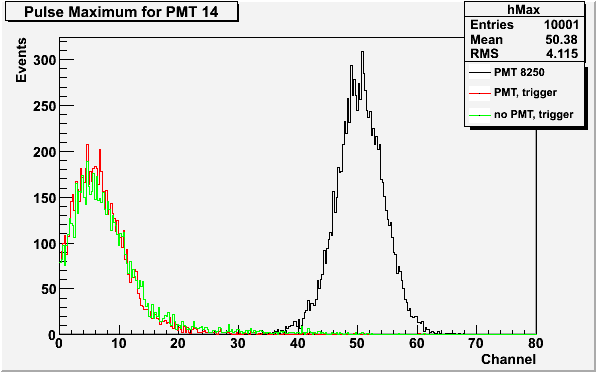
We look at three data runs: PMT 14 self-triggering on light leaks at a 8250 threshold, PMT 14 with an external trigger and no light source, and no PMT with an external trigger. The PMT was biased to 1100V in the runs it was used.
| Figure 4.1: self-trigger and external trigger noise comparison |
|---|
 |
 |
 |
PMT triggering at varying levels of light leakage
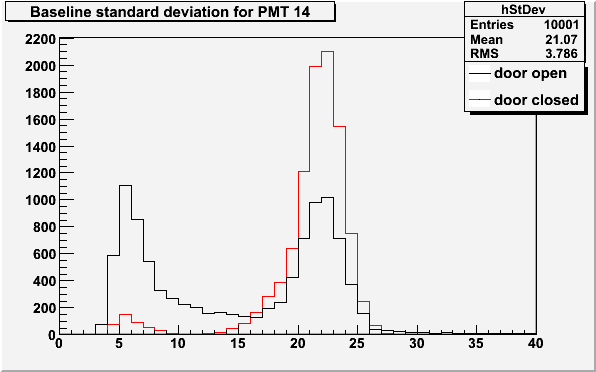
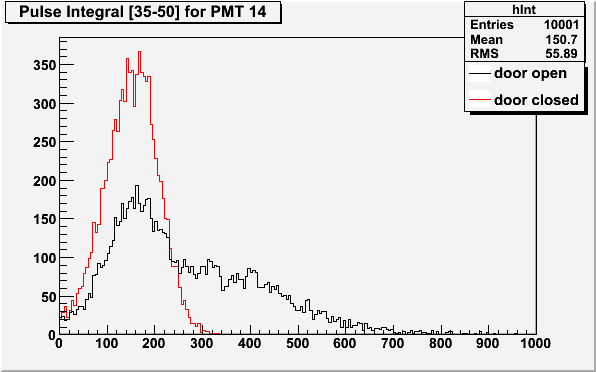
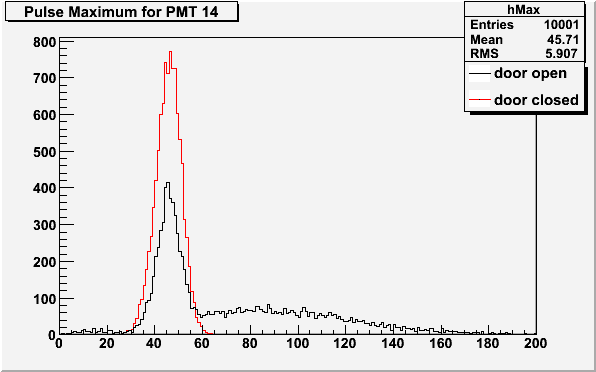
PMT 14 is biased to 1100V and set to self-trigger at a 8270 threshold. Data is taken at two different levels of light leakage, one with the dark room door slightly open, and one with the door shut. The same double-peak feature is observed in the baseline standard deviation histogram.
| Figure 5.1: light leak level comparison |
|---|
 |
 |
 |
PMTs at varying bias voltages
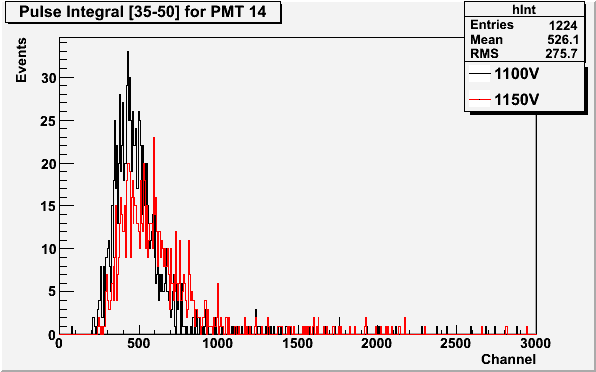
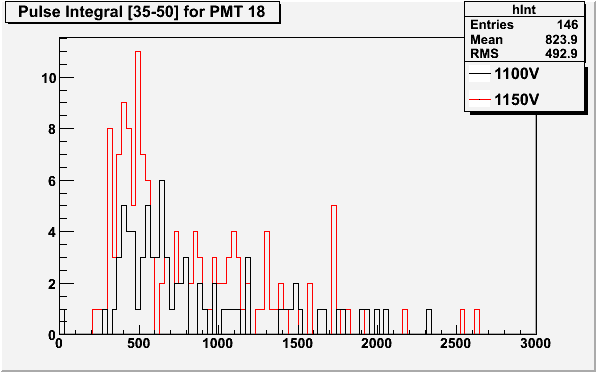
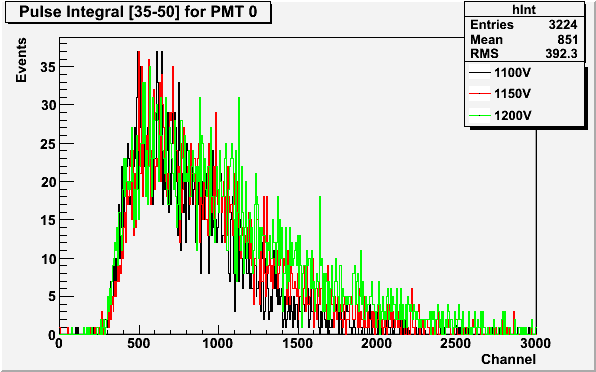
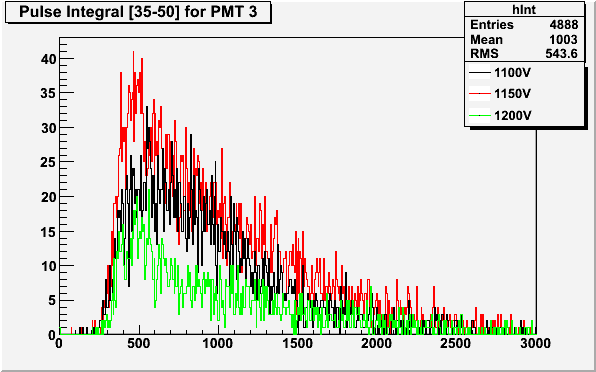
PMTs 3, 18, 14, and 0 tested in a similar setup as above with biases of 1100v, 1150v, and 1200v, triggering on light leaks. Events with baseline standard deviation greater than 15 were discarded.
8270 threshold:
| Figure 6.1: bias comparison for PMT 14 |
|---|
 |
| Figure 6.2: bias comparison for PMT 18 |
|---|
 |
8280 threshold:
| Figure 6.3: bias comparison for PMT 0 |
|---|
 |
| Figure 6.4: bias comparison for PMT 3 |
|---|
 |