PMT Spectra with an Attenuator
PMT 14 was run with a bias voltage of -1100 V with scintillator 1-66-? and varying sources in line with the plastic in the darkroom. The connection to the DAQ board was modified with varying attenuators. Each event was self-triggered with a trigger threshold of 8280 for a total of 100k events.
| Table 1: Data runs |
| Run | Source | Attenuation | Data file |
| 1 | Ba-133 | none | 130827_pmt14_ba133_8280_1100v_x10.dat |
| 2 | Ba-133 | x5 | 130830_pmt14_ba133_8230_1100v_x10_x5atten.dat |
| 3 | Cs-137 | x5 | 130830_pmt14_cs137_8230_1100v_x10_x5atten.dat |
| 4 | Cx-137 | x10 | 130830_pmt14_cs137_8230_1100v_x10_x10atten.dat |
Background
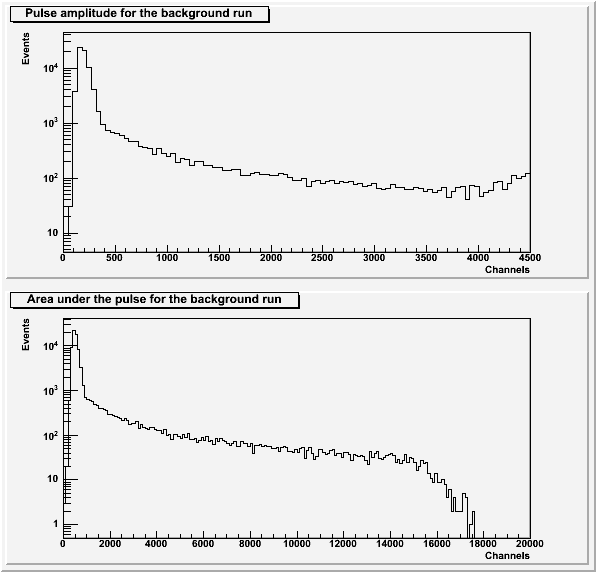
There aren't any background runs completed with attenuated signals. It is assumed that the background is of the similar shape to previous runs. Background spectra shown below taken from here.
| Figure 1: Example background spectra for pulse amplitude and area. |
 |
Barium-133
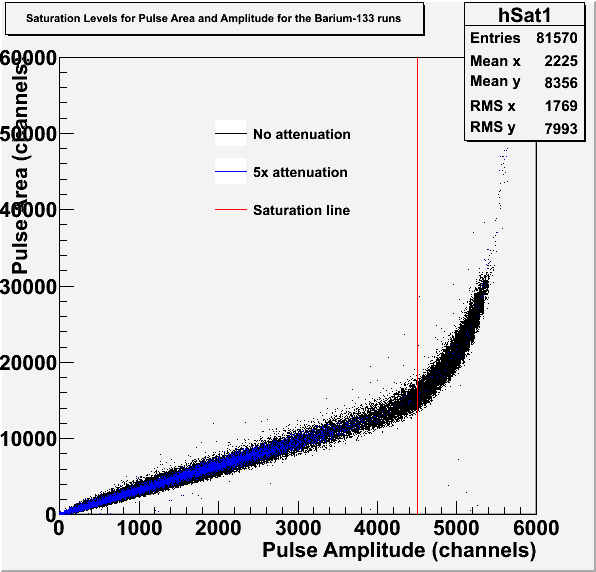
The plot of pulse area vs. pulse amplitude shows the saturated pulses for each attenuation level. The point of saturation is considered to be 4500 channels for pulse amplitude. Pulses with a baseline standard deviation greater than 8 are not included in any of the following figures.
| Figure 2: Pulse area vs. amplitude for Ba-133 runs. |
 |
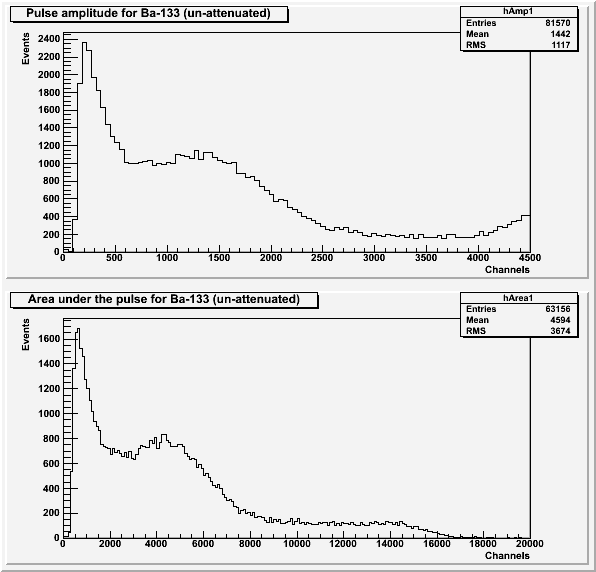
| Figure 3: Pulse area and amplitude for the un-attenuated Ba-133 runs. |
 |
| Figure 4: Pulse area and amplitude for Ba-133 runs with 5x attenuation. |
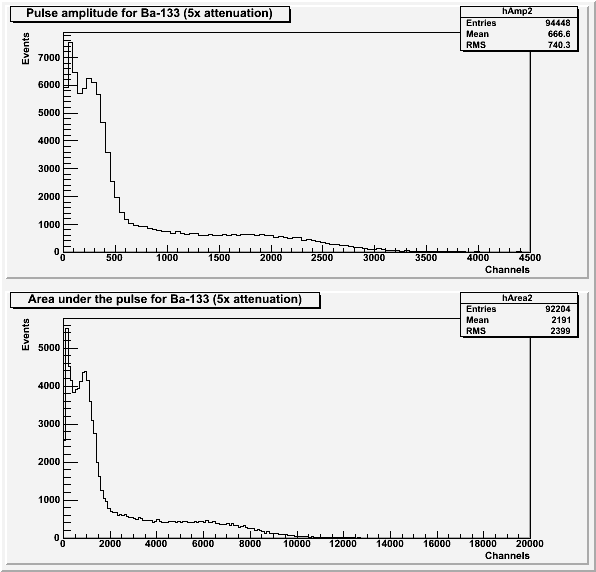 |
The histograms in Figures 3 and 4 do not include pulses with an amplitude greater than 4500 channels. The pulse area histograms also exclude pulses with a secondary pulse before the main pulse.
Cesium-137
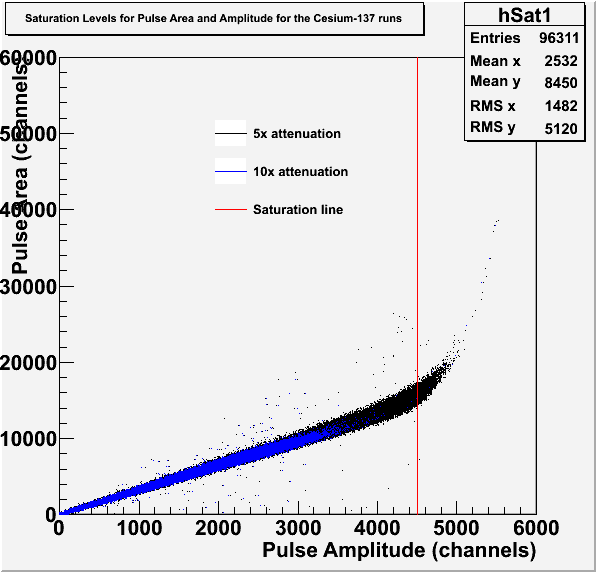
The plot of pulse area vs. pulse amplitude shows the saturated pulses for each attenuation level. The point of saturation is considered to be 4500 channels for pulse amplitude. Pulses with a baseline standard deviation greater than 8 are not included in any of the following figures.
| Figure 5: Pulse area vs. amplitude for Ce-137 runs. |
 |
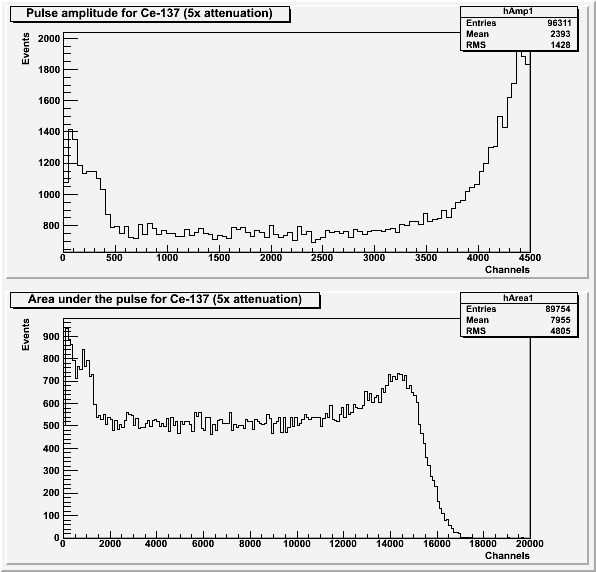
| Figure 6: Pulse area and amplitude for the Ce-137 runs with 5x attenuation. |
 |
| Figure 7: Pulse area and amplitude for Ce-137 runs with 10x attenuation. |
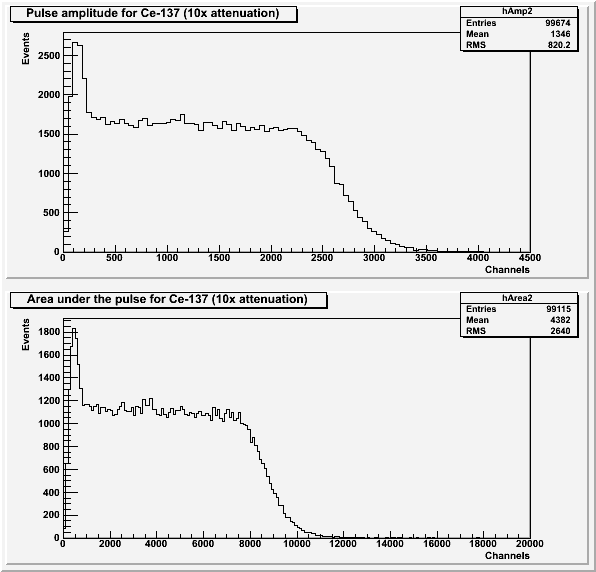 |
The histograms in Figures 7 and 8 do not include pulses with an amplitude greater than 4500 channels. The pulse area histograms also exclude pulses with a secondary pulse before the main pulse.