Ce-137 Comparison to background
SiPM 2 and SiPM 4 were placed in their delrin holders on either side of plastic the scintillator and placed in the darkroom. Each event was self-triggered when both SiPMs were above a trigger threshold of 8320. When a Ce-137 source was present, it was placed 10 cm from the plastic.
| Table 1: Data files used. |
| Run | Source | Scintillator | Fiber | Grease | Number of events | Data file |
| 1 | background | 1-66-? | none | none | 10k | 130722_sipm2+4_background_8320threshold.dat |
| 2 | Ce-137 | 1-66-? | none | none | 10k | 130723_sipm2+4_cs-137_8320threshold.dat |
| 3 | background | 1-74-1 | yes | yes | 10k | 130722_sipm3+4_background_8320threshold_short.dat |
| 4 | Ce-137 | 1-74-1 | yes | yes | 10k | 130724_sipm2+4_cs-136_8320threshold_WLSfiber.dat |
| 5 | background | 1-74-1 | yes | none | 10k | 130725_sipm2+4_background_8320threshold_WLSfiber.dat |
| 6 | Ce-137 | 1-74-1 | yes | none | 10k | 130724_sipm2+4_cs-136_8320threshold_WLSfiber-2.dat |
No Fiber
Background
| Figure 1: Area under the pulse for SiPM 2 only, SiPM 4 only, and SiPM 2 and 4 combined. |
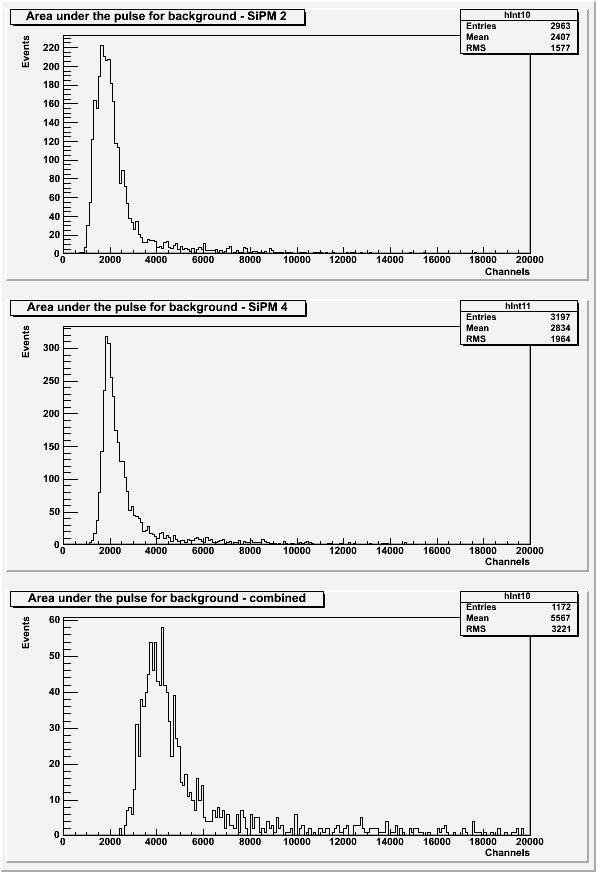 |
The histograms above exclude pulses with a baseline standard deviation greater than 7 or if secondary pulses are present.
Ce-137
| Figure 2: Area under the pulse for SiPM 2 only, SiPM 4 only, and SiPM 2 and SiPM 4 combined. |
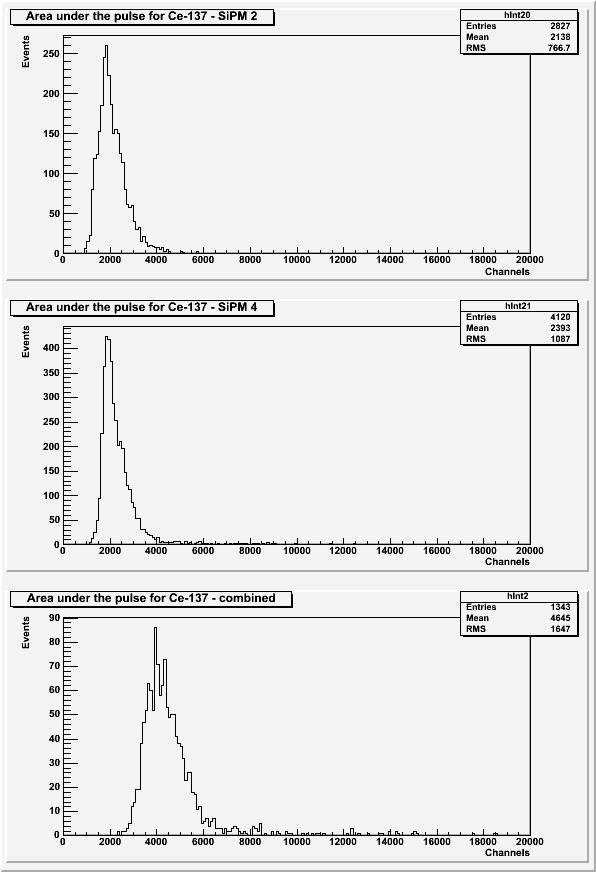 |
The above histograms exclude pulses with a baseline standard deviation greater than 7 or if secondary pulses are present.
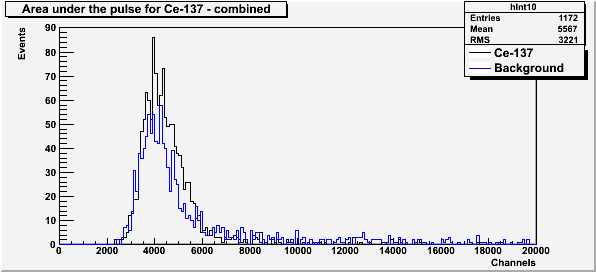
| Figure 3: Comparison of Cesium-137 and background spectra. |
 |
With wavelength shifting fiber and optical coupling grease
Background
Background data were taken two days before the Ce-137 run. Background data previously shown with barium.
| Figure 4: Area under the pulse for SiPM 2 only, SiPM 4 only, and SiPM 2 and SiPM 3 combined. |
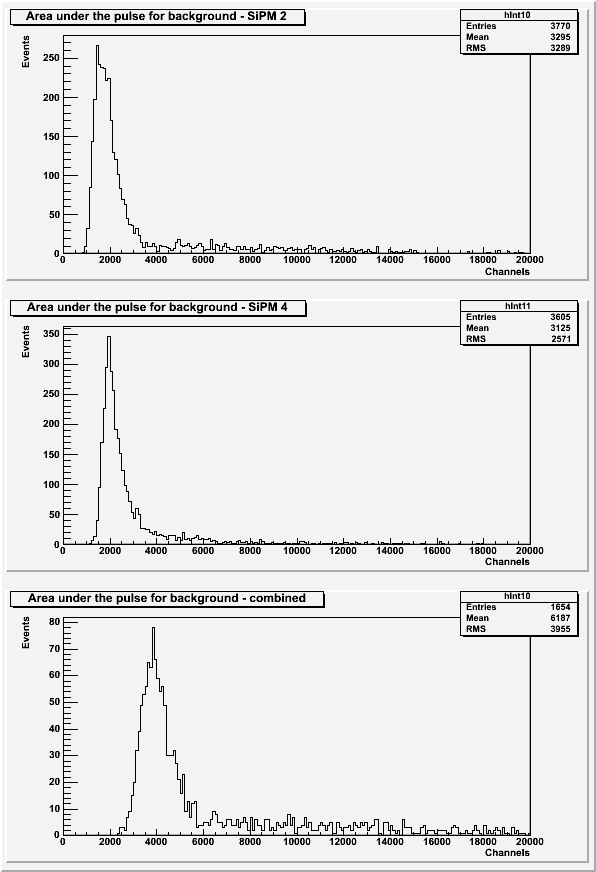 |
The above histograms exclude pulses with a baseline standard deviation greater than 7 or with secondary pulses present.
Ce-137
| Figure 5: Area under the pulse for SiPM 2 only, SiPM 4 only, and SiPM 2 and SiPM 4 combined. |
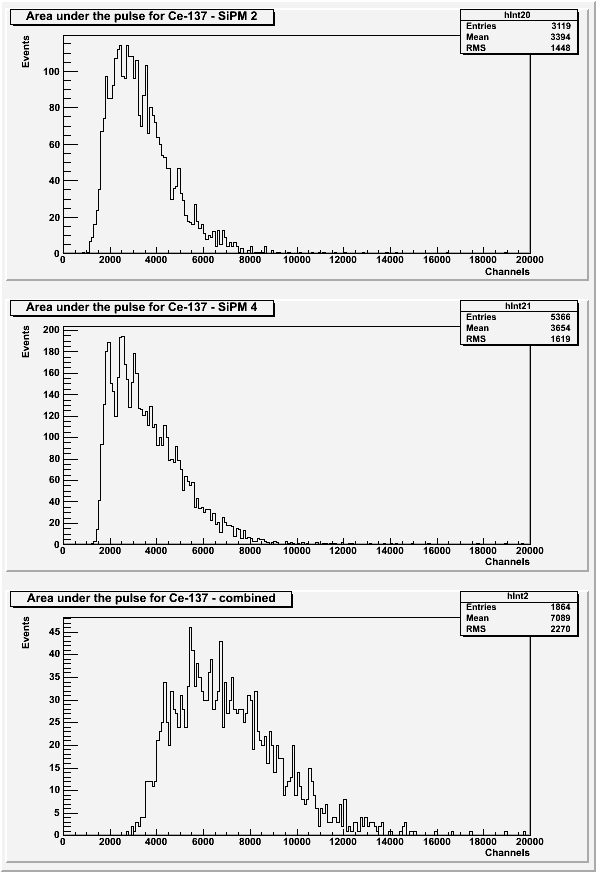 |
The histograms in Figure 5 exclude pulses with a baseline standard deviation greater than 7 or with secondary pulses present.
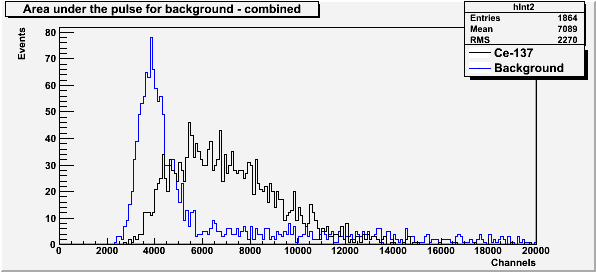
| Figure 6: Comparison of background and source spectra. |
 |
With wavelength shifting fiber and no optical coupling grease
Background
| Figure 7: Area under the pulse for SiPM 2 only, SiPM 4 only, and SiPM 2 and SiPM 3 combined. |
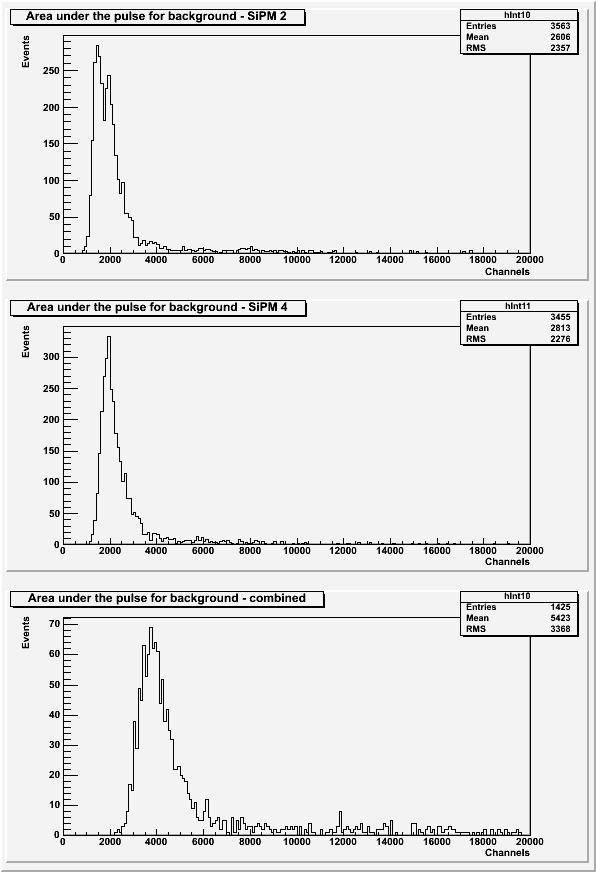 |
The above histograms exclude pulses with a baseline standard deviation greater than 7 or with secondary pulses present.
Ce-137
| Figure 8: Area under the pulse for SiPM 2 only, SiPM 4 only, and SiPM 2 and SiPM 4 combined. |
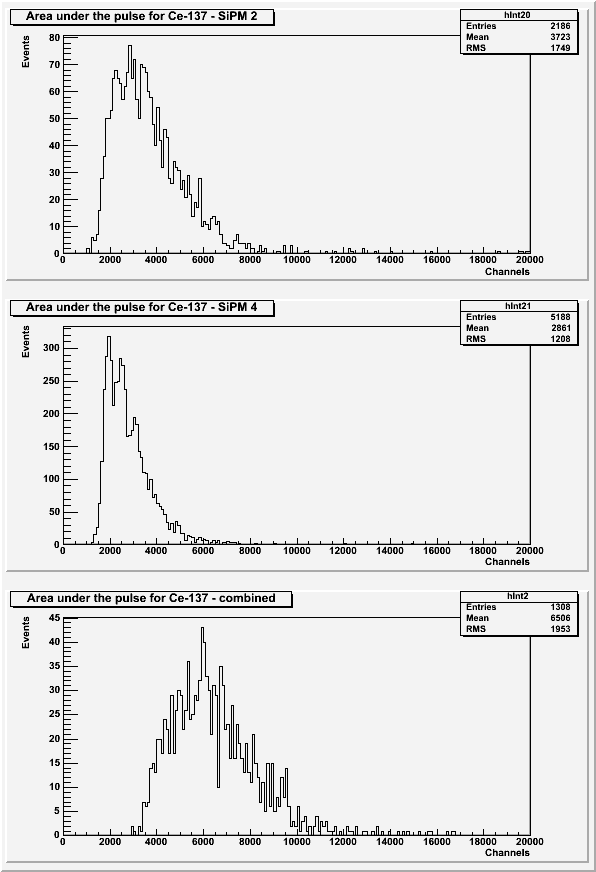 |
The histograms in Figure 8 exclude pulses with a baseline standard deviation greater than 7 or with secondary pulses present.
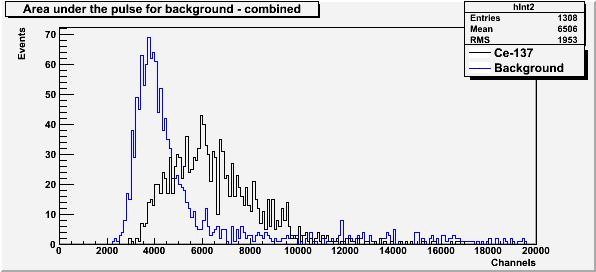
| Figure 9: Comparison of background and source spectra. |
 |
Scintillator Comparison
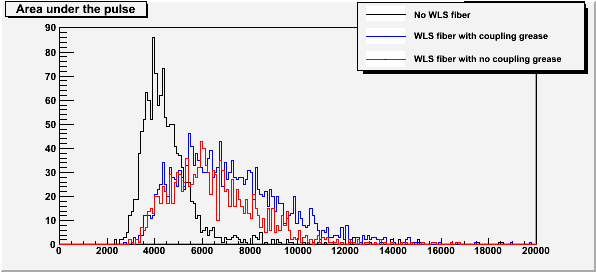
| Figure 10: Comparison of Ce-137 Spectra for each scintillator set-up. |
 |