Attempt to find full Ba-133 peak
Multiple runs with two SiPM at opposite ends of scintillator 1-74-7 with the wavelength-shifting fiber were conducted in the darkroom. Each event was self-triggered when both SiPMs were above the trigger threshold of 8320. When the Ba-133 source is present, it was placed 3 cm from the scintillator. Details of each run are shown below:
| Table 1: Details about each low threshold run. |
| Run | Channel 0 SiPM | Channel 1 SiPM | Source | Number of events | Data file |
| 1 | 3 | 4 | Ba-133 | 10k | 130719_sipm3+4_ba-133_8320threshold.dat |
| 2 | 3 | 4 | Ba-133 | 100k | 130721_sipm3+4_ba-133_8320threshold.dat |
| 3 | 3 | 4 | No source | 100k | 130722_sipm3+4_background_8320threshold.dat |
| 4 | 2 | 4 | Ba-133 | 10k | 130722_sipm3+4_ba-133_8320threshold.dat |
| 5 | 2 | 4 | No source | 10k | 130722_sipm3+4_background_8320threshold_short.dat |
Why SiPM 3 was changed to SiPM 2
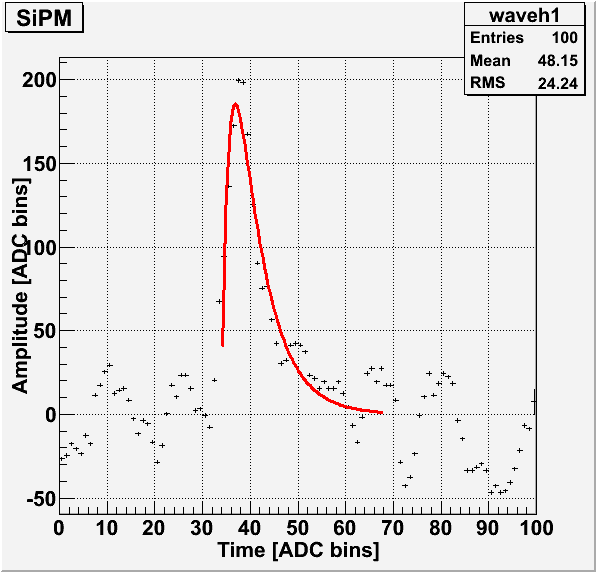
Sometime between run 1 (2013/07/19) and run 2 (2013/07/21) something happened to SiPM 3.
| Figure 1: Example of typical pulse from SiPM3 run 3. |
 |
| Figure 2: Comparison of baseline standard deviations for example runs. |
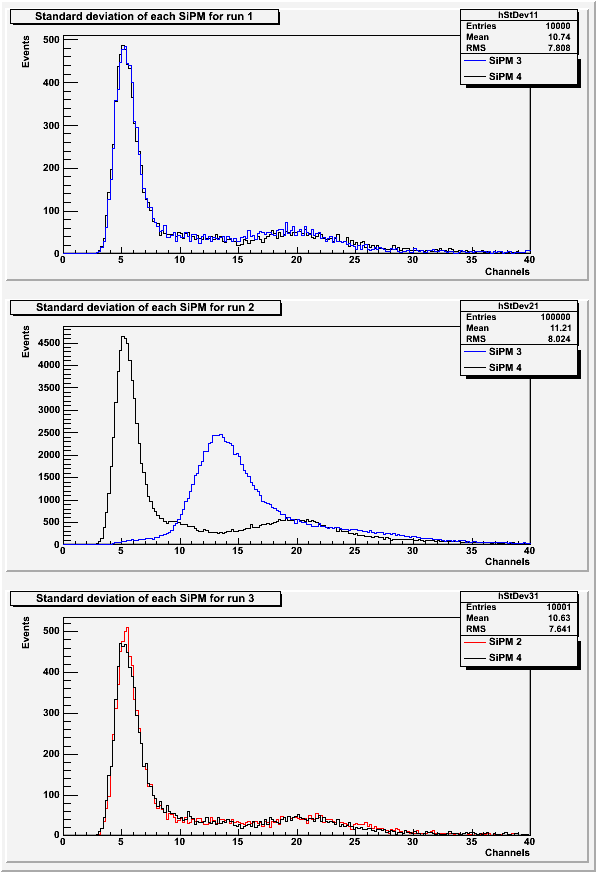 |
The baseline standard deviations from run 1 (Figure 2a) show SiPM 3 and 4 before SiPM went crazy. Figure 2b shows the baseline standard devations of SiPM 3 and 4 after the extra sinusoidal pattern was visible in the pulses of SiPM 3 (Figure 1). Figure 2c shows the baseline standard deviation of SiPM 2 and 4 after SiPM 3 was removed from the set-up.
| Figure 3: Comparison of area under the pulse for SiPM 3 (run 1), SiPM 3 (run 2), and SiPM 2 (run 4). |
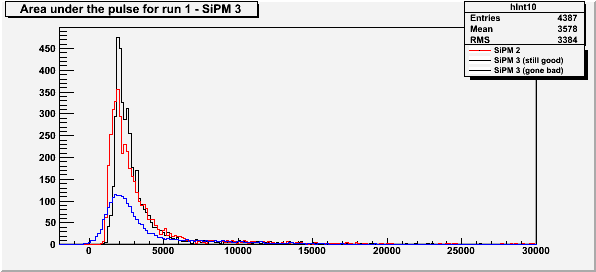 |
The histogram of Run 2 in Figure 3 has been scaled by 1/10 to match the total number of events of Runs 1 and 4.
Ba-133 and Background runs with SiPM 3 and SiPM 4
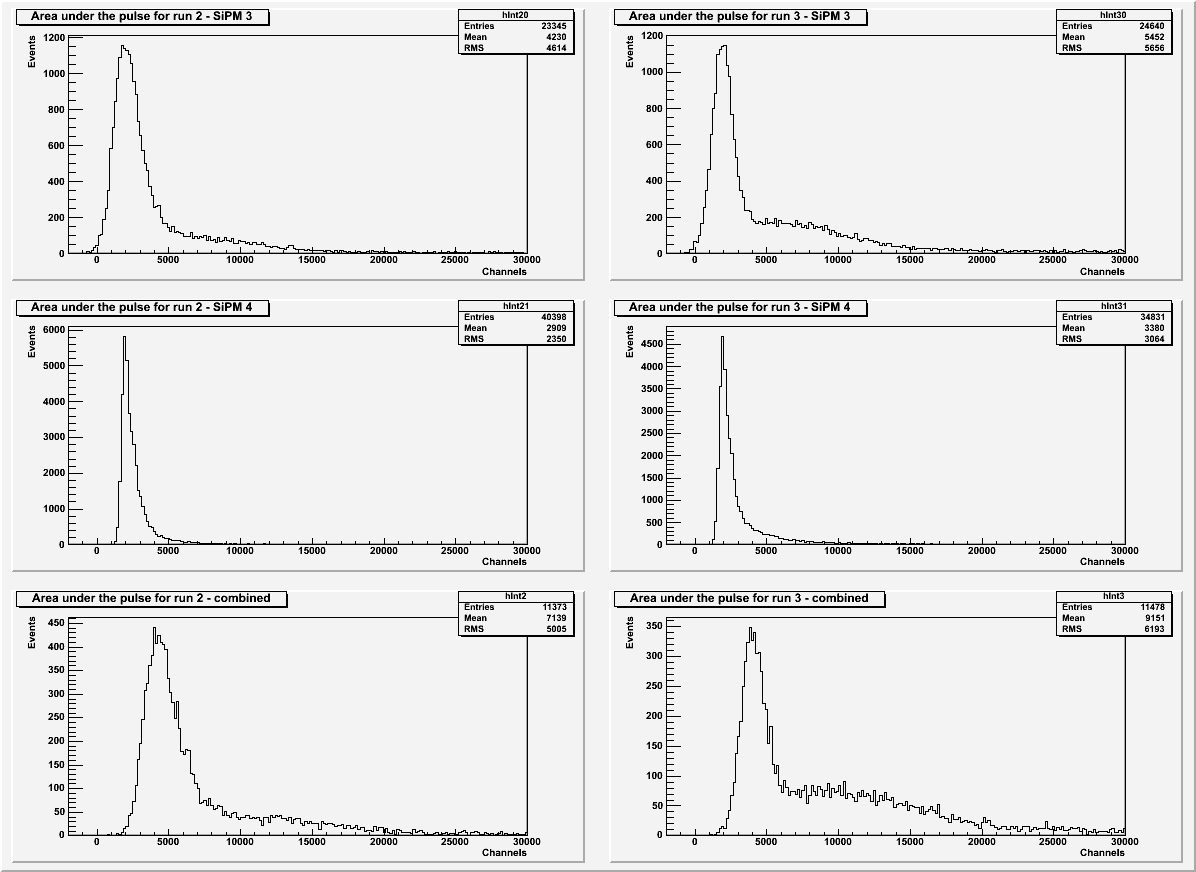
| Figure 4: Area under the pulse for SiPM 3 only, SiPM 3 only, and SiPM 3 and SiPM 4 combined. |
 |
| Figure 5: Comparison of background and source spectra for SiPM 3 and SiPM 4. |
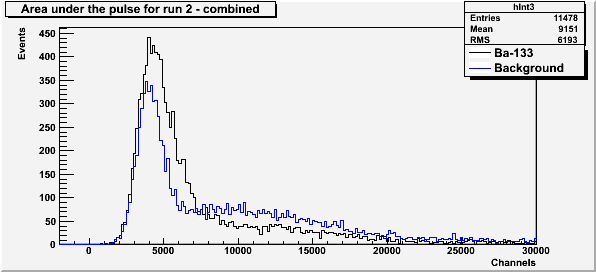 |
All histograms involving SiPM 3 have been gain-matched to SiPM 4. For SiPM 3, pulses with a baseline standard deviation greater than 15 are excluded from the histograms. For SiPM 4, pulses with a baseline standard deviation greater than 7 are excluded. All histograms exclude data with secondary pulses present.
Ba-133 and Background runs with SiPM 2 and SiPM 4
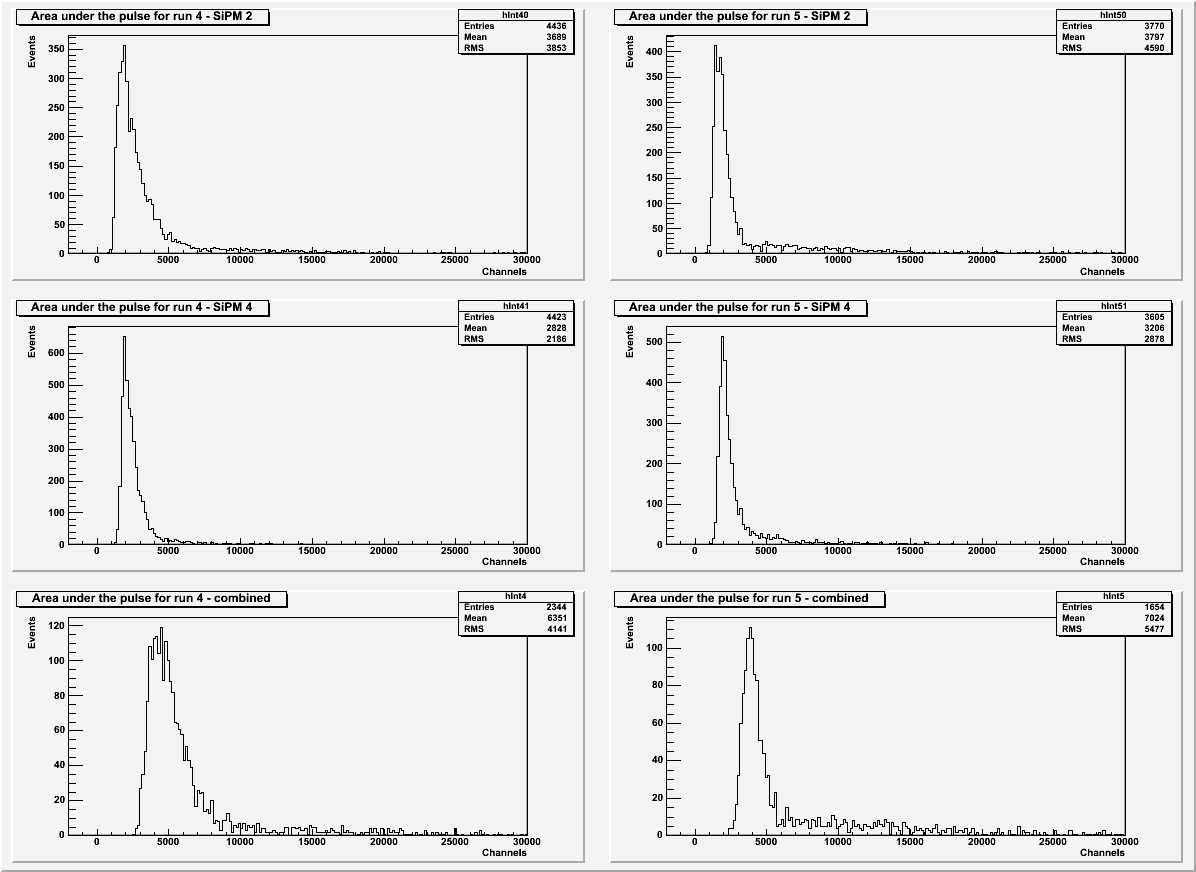
| Figure 6: Area under the pulse for SiPM 2 only, SiPM 4 only, and SiPM 2 and SiPM 4 combined. |
 |
| Figures 7: Comparison of background and source spectra for SiPM 2 and SiPM 4. |
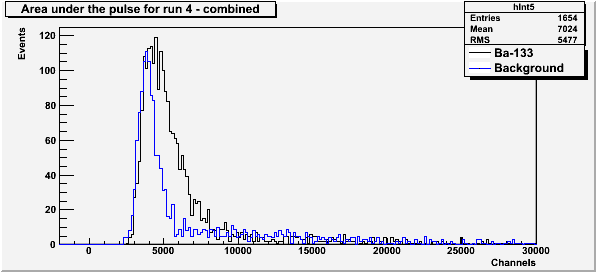 |
All histograms above exclude data with a baseline standard deviation greater than 7 or with secondary peaks are present.