−Table of Contents
Scintillator Light Loss Study (v3)
My goal was to investigate which elements of the simulation resulted in greater photon generation, and to replicate the physical light loss measurement if possible. I investigated the following properties:
- PTFE reflectivity (1.00, 0.99, 0.98, 0.95)
- Al Mask reflectivity (1.00, 0.99, 0.98, 0.95) (keeping PTFE reflectivity fixed at 0.99)
- Al Hole size (ranging in 0.2 mm steps from 1 mm up to 2.4 mm) (keeping PTFE reflectivity fixed at 0.99; doing the full range for AlReflectivity = 1.00, and doing most of the range for the others)
- Air gap (none vs. 1 micron vs 0.1 mm vs 1 mm; for comparison, PTFE thickness is 0.5mm) (keeping above 3 fixed, with PTFE_R=0.99, AL_R=1.00, Al_hole=2.2 mm)
- WLS Fiber Size (none vs. 1.03 mm vs. 2.06 mm, for both masked (Al_R=1.00, Al_hole=2.2mm) and unmasked (PTFE_R=0.99 in both cases)
- NOTE: Bulk attenuation length is held constant at 2.5m for these runs
I will be examining the number of PE detections in each case, seeking to obtain a computational analogue to our experimental data posted here: Effect of WLS Fiber on Energy
First, the PE counts from the unmasked (“whole”) scintillator are shown below. Each PE mean and uncertainty was obtained by fitting a Gaussian to the PE count peak location, and the uncertainty was taken as the statistical uncertainty on that mean location (this is not the same uncertainty obtained by using the std. dev. of the Gaussian).
PE Counts, unmasked sample
| PTFE Reflectivity | PE Count Mean |
|---|---|
| 1.00 | 2019 +/- 9, 275 |
| 0.99 | 1872 +/- 7, 243 |
| 0.98 | 1770 +/- 7, 244 |
| 0.95 | 1552 +/- 13, 197 |
| 1.00 (20 cm Att Length) | 1085 +/- 9, 174 |
For comparison, the experimental unmasked results yielded 1770 +/- 20 PE. This indicates that a PTFE reflectivity of R=0.98 as the most appropriate choice. This agrees with measurements of PTFE reflectivity Study on PTFE reflectivity, cites 99% above 350 nm cites reflectivity of 95%+ achievable depending on number of layers wrapped, especially above 0.5mm which is the PTFE thickness I'm using. However, the following data was generated for PTFE reflectivity of R=0.99, the highest realistic upper bound on what we might be able to cite as our real reflectivity.
The two most important parameters for the PE counts in the masked sample were the size of the hole in the Al mask and the Al reflectivity. I chose a range of reflectivities for Al to be 0.95 - 1.00, a realistic upper bound for highly reflective types of Al foil. I also discovered that we may have been dramatically underestimating what might be realistic for the Al hole size. I tried poking some holes and measured them (see previous meeting). With this in mind, I chose to vary the Al Hole size from 1.05 mm up to 2.6 mm, with varying reflectivities from 0.95 to 1.00:
PE Counts (PTFE R=0.99)
| Al Reflectivity \ Hole Size | 1.05 mm | 1.2 mm | 1.4 mm | 1.6 mm | 1.8 mm | 2.0 mm | 2.2 mm | 2.4 mm | 2.6 mm |
|---|---|---|---|---|---|---|---|---|---|
| 1.00 | 195 +/- 5 | 213 +/- 8 | 223 +/- 9 | 259 +/- 8 | 297 +/- 10 | 345 +/- 14 | 352 +/- 16 | 403 +/- 7 | 409 +/- 18 |
| 0.99 | - | - | 214 +/- 7 | 236 +/- 10 | 286 +/- 8 | 302 +/- 12 | 356 +/- 6 | 372 +/- 9 | |
| 0.98 | - | - | 207 +/- 5 | 213 +/- 8 | 262 +/- 5 | 274 +/- 8 | 315 +/- 3 | 348 +/- 6 | |
| 0.95 | - | - | 179 +/- 5 | 199 +/- 4 | 208 +/- 6 | 241 +/- 4 | 259 +/- 8 | 313 +/- 4 |
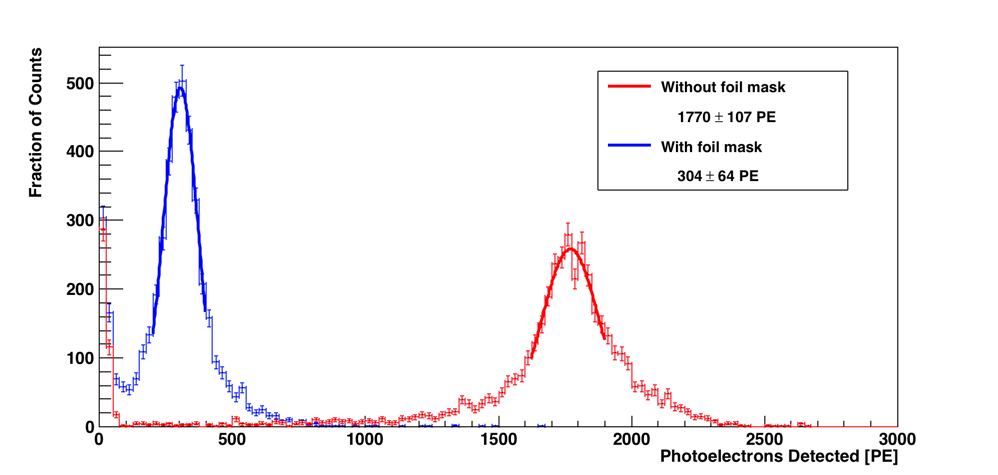
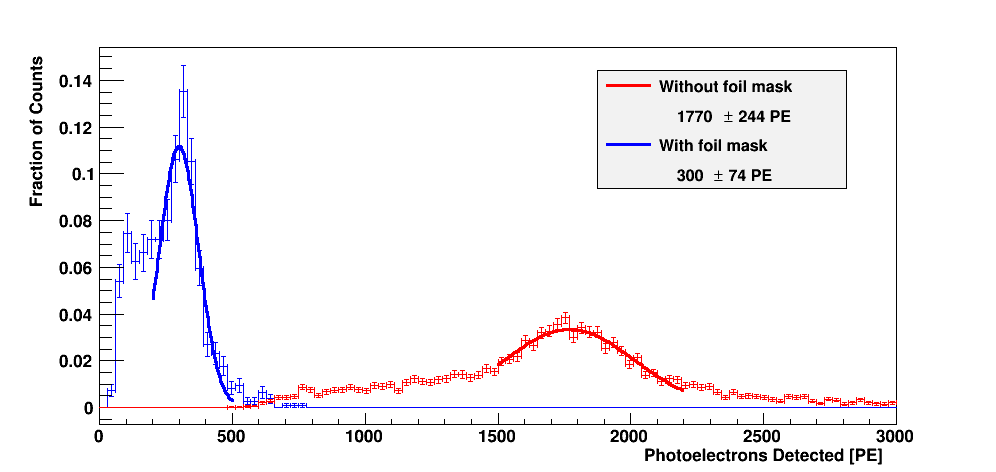
For comparison, the experimental case yielded about 304 +/- 11 PEs. I've bolded the statistically similar results in the above table. A comparison of the two experimental/computational results are shown below (Al=0.99, R=0.99, Hole=2.0mm for computational result):
Experimental result, PE Counts
Computational result, PE Counts
The “default” settings for the special case comparisons:
- Al Reflectivity: 1.00 (chosen beforehand, but this accentuates and possible differences between each special case since the photons are more numerous and therefore more sensitive to changes)
- PTFE Reflectivity: 0.99
- Air gap: 0.1 mm (kept for all runs since it didn't end up making a statistically significant difference)
- The geometry: an elliptical tube of major axis 21.14 mm, minor axis 19.38 mm, length 4.5 cm.
- Hole size: 2.2 mm (chosen for the comparison below so that we can accommodate a double-diameter WLS fiber with some gap still left)
The muons are incident in a 2cm by 2cm rectangle projected onto the scintillator (with this square centered 2.25 cm down the length of the scintillator), as if it was being triggered from two crossed scintillator paddles. The muons crossed the “short” end of the cross-section of the elliptical cylinder (i.e. parallel to the 19.38 mm axis of the ellipse)
Using these default settings, I tested a few special parameters: Air gap (with and without the mask) and WLS fiber size (to see if a larger fiber made a difference with the same Al hole size):
PE Counts, special cases
| Masked? | PTFE Reflectivity | Air Gap Size | PE Counts |
|---|---|---|---|
| Unmasked | 0.95 | 0 micron | |
| Unmasked | 0.95 | 1 micron | |
| Unmasked | 0.95 | 100 micron | 1552 +/- 13 |
| Unmasked | 0.95 | 200 micron | |
| Unmasked | 0.99 | 0 micron | 1789 +/- 15 |
| Unmasked | 0.99 | 1 micron | 1921 +/- 26 |
| Unmasked | 0.99 | 100 micron | 1872 +/- 7 |
| Unmasked | 1.00 | 1 micron | 2039 +/- 21 |
| Unmasked | 1.00 | 100 micron | 2019 +/- 9 |
| Masked | 0.99 | 0 micron | 232 +/- 4 |
| Masked | 0.99 | 100 micron | 352 +/- 16 |
| Masked | 0.99 | 200 micron | 281 +/- 20 |
| Masked? | PTFE Reflectivity | Air Gap | WLS Diameter | PE Counts |
|---|---|---|---|---|
| Unmasked | 0.99 | 100 micron | 0 mm | 1761 +/- 14 |
| Unmasked | 0.99 | 100 micron | 1.03 mm | 1825 +/- 24 |
| Unmasked | 0.99 | 100 micron | 2.06 mm | 1974 +/- 25 |
| Masked | 0.99 | 100 micron | 0 mm | 185 +/- 20 |
| Masked | 0.99 | 100 micron | 1.03 mm | 352 +/- 16 |
| Masked | 0.99 | 100 micron | 2.06 mm | 391 +/- 5 |
All of the data used here is stored in /data/cdms1/schmitz/paper/muon6/
Conclusions and comments
- It seems that the presence of a small airgap is a physical feature which allows us to more accurately represent the processes that are occurring in the sim. It makes a huge difference in the final PE count totals for the masked simulation, and a small but measurable difference for the unmasked run.
- The Al mask hole size is as important or more important than the reflectivity of the Al mask.
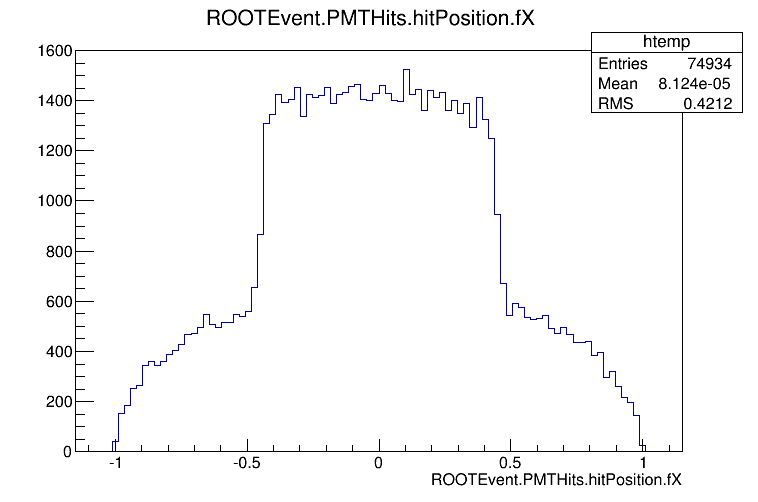
- The WLS makes a noticeable impact, with the double-diameter fiber generating slightly more PE detections than the standard diameter. This impact of the WLS fiber is especially clear when one inspects the PMT PE hit position. I've shown the X position of detected PEs for the Al=0.99, R=0.99, Al_hole=2.0mm run below:
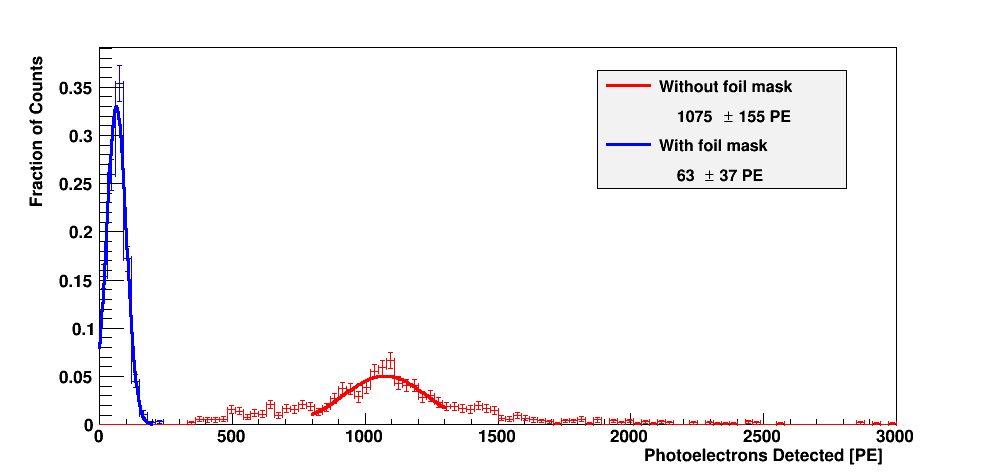
- Reducing the attenuation length of the scintillator totally destroys our ability to recover valid data. Even for the best-case scenario for the unmasked measurement (1 micron air gap, perfect reflectivity) we are nowhere close to achieving a direct comparison to experiment. The 20cm attenuation length case is shown below, with a 1 micron airgap:
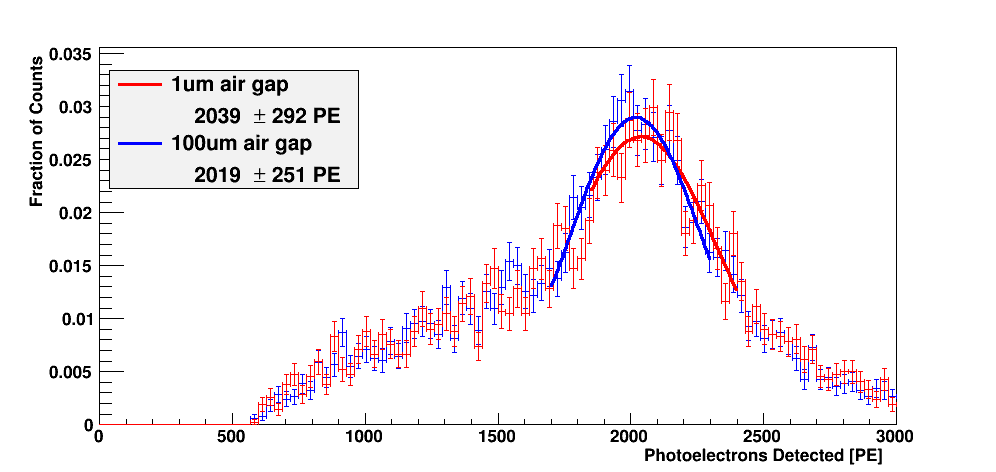
- Changing the size of the air gap from 0.1mm to 1 micron seems to not make much of a difference; here's the plot of the comparison for the unmasked sample:
Investigating the PE count shoulder
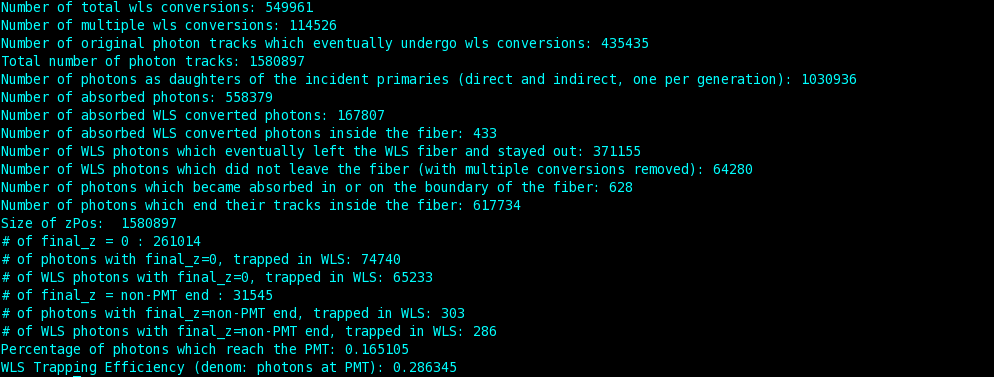
I've attached two data outputs analyzing the Al99R99Hole2p0mm run, for 400>PECount>200 and PECount<200:
200<PECount<400
PECount<200
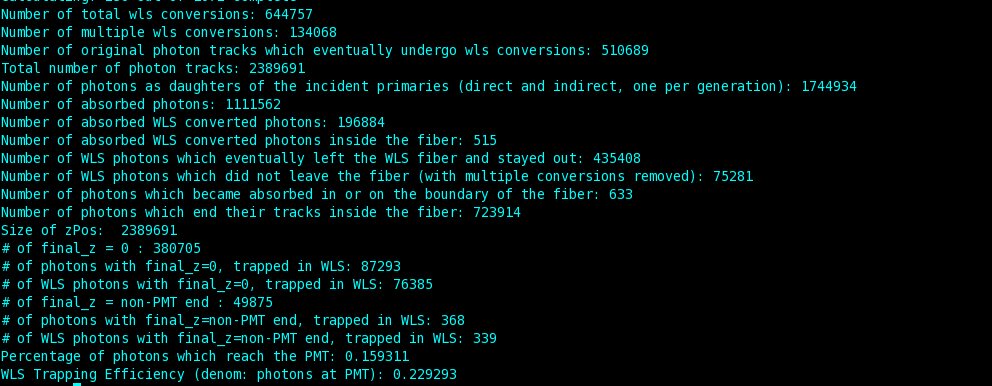
Values to focus on: (250 events analyzed for 200minus, 50 events for 200plus)
- Number of photons as daughters of incident primaries (1744934 vs 1030936) (0.591)
- Number of original photon tracks which undergo wls conversions (510689 vs 435435) (0.293 vs 0.422)
- Number of photons with final_z=0 (380705 vs 261014)
- Number of photons with final_z=0 via WLS (87293 vs 74740)
- Number of WLS photons with final_z=0 (76385 vs 65233)
It seems that more photons are being generated in the first place in the higher PE Count detections, and these additional photons are also WLS converted more often