Coincidence timing
Cut example
Here we load sample NaI-triggered data and apply correction & calibration.
// load NaI series into one chain
gStyle->SetOptStat(0)
gStyle->SetOptFit(1)
TString datapath ="/data/chocula/fritts/data/k100proc/midasrq/byseries/"
TString ser[] = {"07220916_2059","07220916_2200","07220917_1039","07220917_1225","07220917_2125","07220917_2155"}
//TString lab[] = {"0V","-4V","-21V","-65V","-84V","-84V"}
int nser = 6
TChain *e
TChain *z
e = new TChain("rqDir/eventTree")
z = new TChain("rqDir/zip1")
// load odd-numbered series only, those are the NaI-triggered series
for(int s=0;s<nser;s++)if(s%2==1)e->Add(Form("%s/%s/umn*root",datapath.Data(),ser[s].Data()));
for(int s=0;s<nser;s++)if(s%2==1)z->Add(Form("%s/%s/umn*root",datapath.Data(),ser[s].Data()));
z->AddFriend(e)
//z->SetLineColor(kRed)
TCut crand = "EventCategory"
z->SetAlias("PTwid","(PTWKf40-PTWKr40)*1e6")
z->SetAlias("xdel","1e6*(PEWKr20-0.5*(PCWKr20+PDWKr20))-1")
z->SetAlias("ydel","1e6*(0.866*(PDWKr20-PCWKr20))+9")
// note empirical offsets in xdel, ydel
z->SetAlias("phidel","180./3.14159*atan2(ydel,xdel)")
z->SetAlias("afdel","1e6*(PFWKr20-PAWKr20)")
//
TCut cgoodwalk = "PCWKr20>0.25e-3&&PCWKr20<0.5e-3&&PDWKr20>0.25e-3&&PDWKr20<0.5e-3&&PEWKr20>0.25e-3&&PEWKr20<0.5e-3"
// Correction & Calibration
//
z->SetAlias("pt_keV","7.738820e+07*PTOFamps+1.653756e+13*PTOFamps**2")
z->SetAlias("pt0_keV","7.738820e+07*PTOFamps0+1.653756e+13*PTOFamps0**2")
z->SetAlias("PSUMbs","PAbs+PBbs+PCbs+PDbs+PEbs+PFbs")
//
z->SetAlias("BSel","PSUMbs-18400")
//
z->SetAlias("pt_keV_bscorr","pt_keV/(1.-0.0461538*BSel/165)")
z->SetAlias("pt0_keV_bscorr","pt0_keV/(1.-0.0461538*BSel/165)")
TCut cbs = "BSel<1100"
//
// note: this is an averaged calibration, rather than a time-dependent one. Not as precise.
z->SetAlias("pt_keVee","14.0821*pt_keV_bscorr/(333.899-pt_keV_bscorr)")
z->SetAlias("pt0_keVee","14.0821*pt0_keV_bscorr/(333.899-pt0_keV_bscorr)")
Now let's create a coincidence timing cut. We use the PTOFdelay quantity. This is the time that the OF integral finds as the start time of the pulse. If we plot this time versus energy (over a fairly wide energy range) we see a clear band of coincident events.
// find coincidence timing
z->Draw("PTOFdelay/0.8e-6:pt_keVee",!crand+cbs+"pt_keVee>0&&pt_keVee<200")
// note: cofint cuts don't work for higher energies, so better not to use here
// and cam cut is not necessary - stats are higher without it
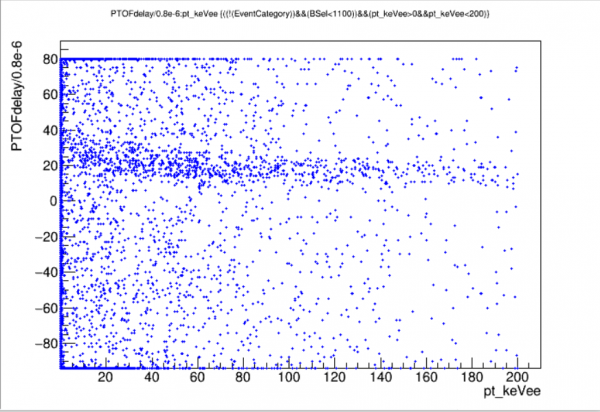
Note this band is not present when randoms are selected, rather than NaI-triggered events. This is as expected - pulses randomly appear at any time in the OF time range when we take random traces.
TCut ccoin = "PTOFdelay/0.8e-6>8&&PTOFdelay/0/8e-6<40"
The cut is meant to be good for a wide range of energy, so that we can study the coincident spectrum not only in the signal region but also at higher energies.