Table of Contents
Run 75 Summary
Run preparation
Setup
| Run 75 Channel Map | |||||
|---|---|---|---|---|---|
| Tower | Cable | DCRC(2sided) | Label | HV output, Side1-readout | HV output, Side2-readout |
| Face5pA | Cable 2 (includes LEDs) HV CONN1 | DCRC1 | Side1pE | HV1 pA | - |
| Face5pB | Side1pB | HV1 pB | - | ||
| Face5pC | Side1pD | HV1 pC | - | ||
| Face5pD | Side2pE | - | HV2 pD | ||
| Face3pA | Cable 1 (includes accessories) HV CONN2 | DCRC3 | Side2pC | - | HV2 pA |
| Face3pB | Side2pF | - | HV2 pB | ||
| Face3pC | Side1pC | HV2 pC | - | ||
| Face3pD | Side1pF | HV2 pD | - | ||
| Face2pA | Cable 3 HV CONN3 | DCRC4 | Side2pB | - | HV1 pA |
| Face2pB | Side2pA | - | HV1 pB | ||
| Face2pC | Side1pA | HV2 pB | - | ||
| Face2pD | Side2pD | - | HV1 pD | ||
IbIs measurements
Overview of automated IbIs technique
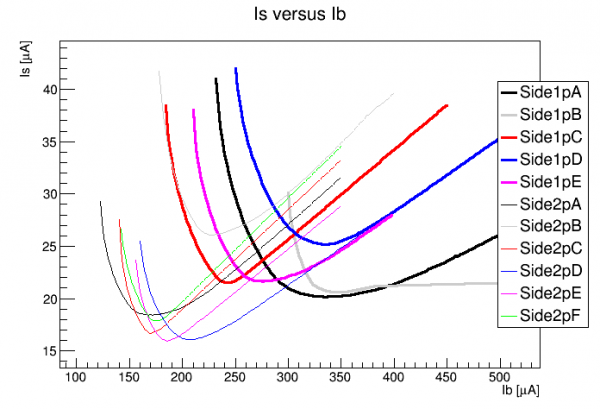
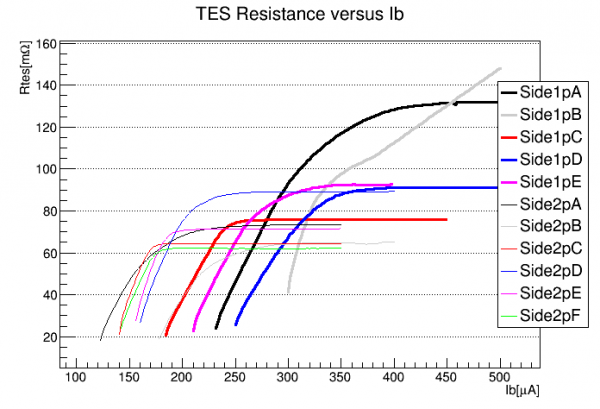
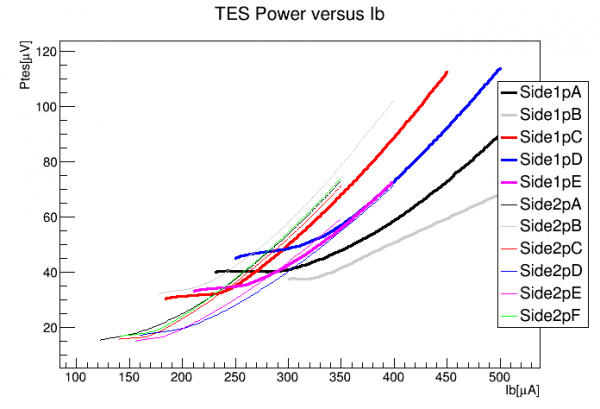
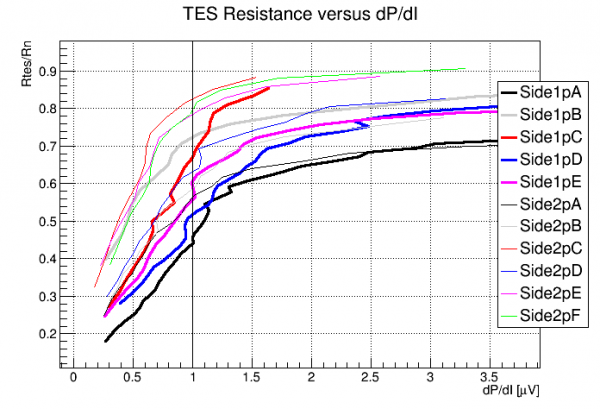 |
| This plot compares the TES resistance (normalized to R_normal) to dP/dI. I've been setting the QET biases to match dP/dI = 1.0 μV. This is pretty different from fixing a certain fraction of Rn. The resistance fraction is pretty high for some of the Side2 channels. |
TES properties
| Channel | Tc [mK] | Rn [mΩ] | Rpar [mΩ] | Rop/Rn |
|---|---|---|---|---|
| Side1pA | 81.9 | 124.9 | 12.1 | 0.42 |
| Side1pB | 86.0 | 95.0 | 15.2 | 0.58 |
| Side1pC | 77.0 | 73.4 | 8.3 | 0.63 |
| Side1pD | 78.0 | 89.7 | 13.1 | 0.50 |
| Side1pE | 76.0 | 89.1 | 10.7 | 0.52 |
| Side1pF | ||||
| Side2pA | 72.5 | 68.6 | 6.8 | 0.61 |
| Side2pB | 77.5 | 65.6 | 7.6 | 0.60 |
| Side2pC | 70.0 | 60.8 | 11.0 | 0.79 |
| Side2pD | 69.9 | 76.3 | 12.2 | 0.62 |
| Side2pE | 69.0 | 69.9 | 15.1 | 0.79 |
| Side2pF | 69.0 | 58.7 | 9.2 | 0.83 |
| Average | 75.2 | 79.3 | 11.0 | 0.63 |
Notes:
- Critical temperature (Tc) is an average of all measurements. In some cases the start and end temperatures were measured while warming and cooling; in others only one value was measured while cooling.
- Resistance measurements are based on the assumption that Rshunt = 8.0 mΩ.
- Normal resistance (Rn) shown are from IbIs taken around 42 mK. From the earlier IbIs taken at 50-56 mK the Rn's come out around 5% higher on average.
- Parasitic resistance (Rpar) is based on fitting the lowest part of the transition curve (not sure about the accuracy).
- Operating resistance as a fraction of normal (Rop/Rn) is based on the standard adopted for Run 75 (at least for 2-sided 0-V data) of choosing a point in transition at which dP/dI = 1.0 μV. Figures shown are for temperatures around 42 mK which is the average base after the early part of the run. But they're not much different at higher temperatures.
Source mover
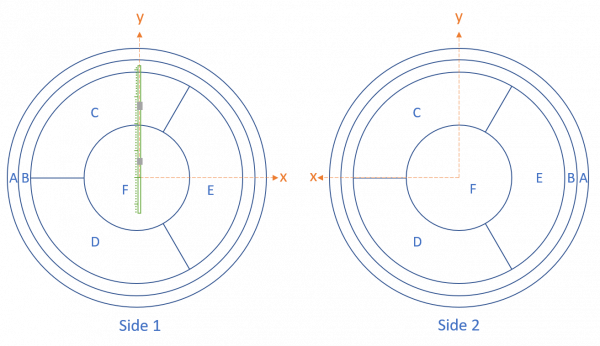
Source mover is mounted above Side 1 and the far endstop is oriented in the +y direction. The +y direction is toward pC, away from pD on both sides, and “parallel” to pE.
Noise width
As of 2022 Feb 7 the best noise width measured is 6.5 eVee, for Side1 with pF not working, at approx +100V bias with pre-biasing and with the source situated at y=30mm, above pC.
The following plots illustrate how this was measured:
| 07220205_1128: Side1 readout, 98.1V with 5min/15% prebias, Source y=30.03mm | |
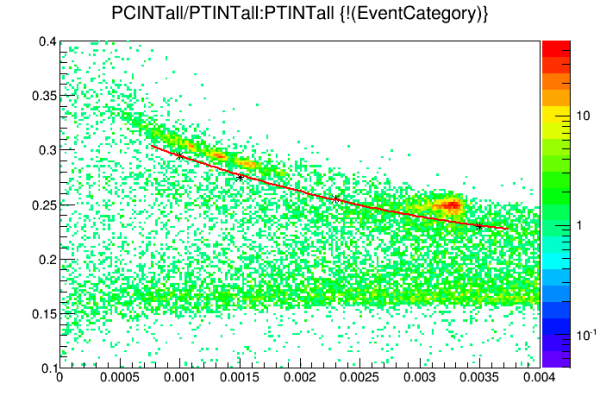 | Cut to select lower Am-241 peaks. Note INT quantities are used instead of OF |
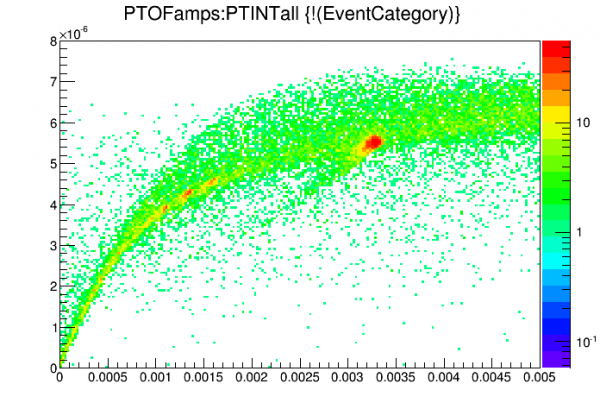 | Comparing OF to INT shows saturation effects in fitting, OF flattens out by 60keV. Clearly PT pulse shape is much different even at the lower Am peaks. |
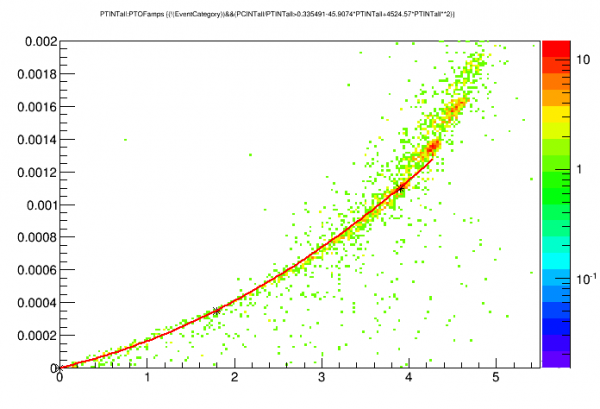 | Here we plot INT versus OF to “linearize” OF (with respect to INT). The fit is a quadratic fixed at (0,0) and extending out to the 14keV peak |
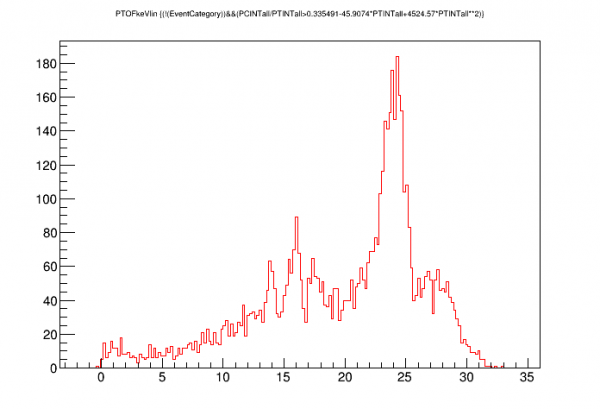 | Low-energy Am spectrum using “linearized” OF. Use the 14 keV peak to calibrate to keVee. |
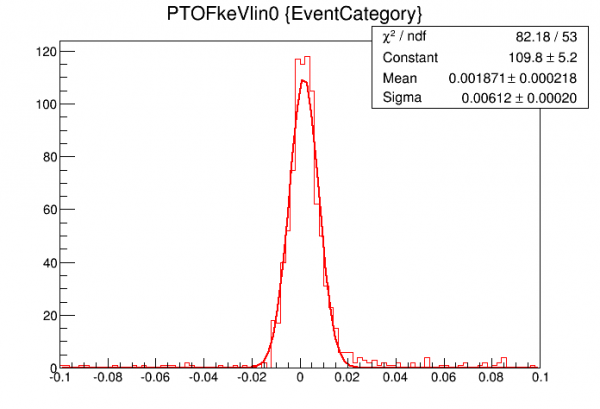 | Standard noise-width plot: calibrated&linearized OF plotted for 1000 randoms using OF0 quantity (fixed-time OF fit) |
| 07220213_2057: Side2 readout, 98.6V with 5min/15% prebias, Source y=0.03mm | |
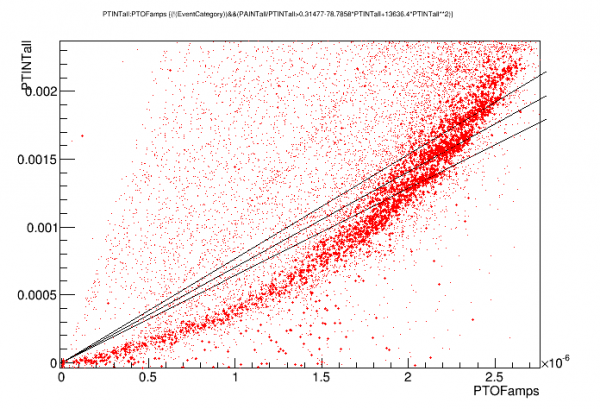
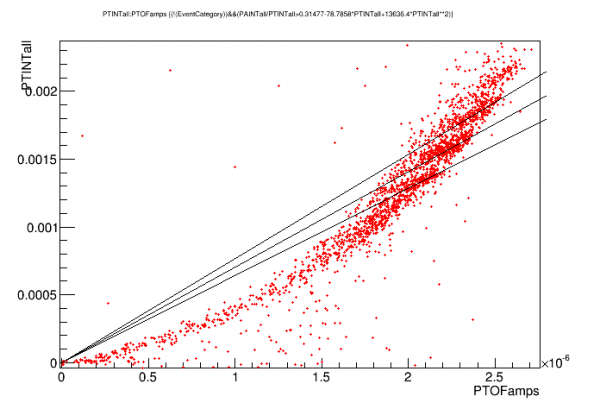 | For some reason with Side2 data, the peaks are more difficult to see in either OF or INT. This can be seen in this plot: projecting the peaks to either axis you get a lot of overlap, although the peaks are relatively well resolved along diagonal lines - which means that the ratio of OF to INT has better energy resolution - which means pulse shape has better energy information around 14keV than amplitude. |
 | |
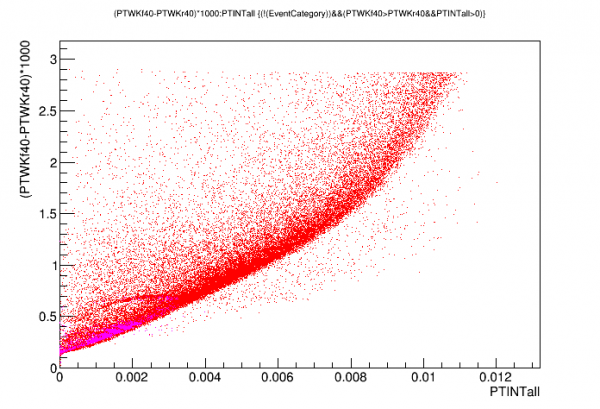 | Here we see how strongly pulse shape changes with amplitude. PT pulse width (40% rise to 40% fall) versus PT_integral is plotted. |
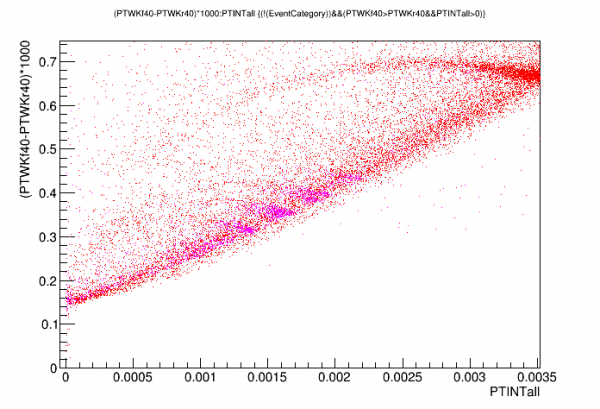 | Same as above with low Am-peaks highlighted |
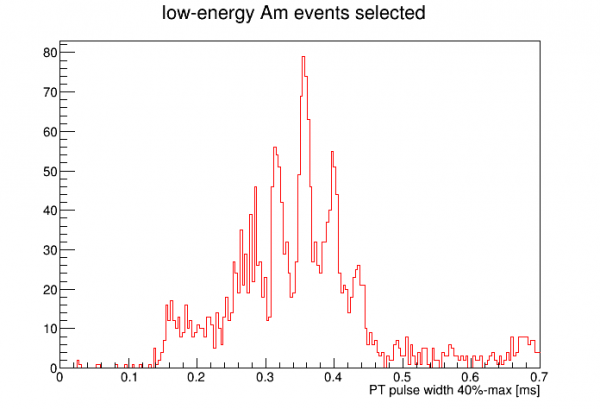 | Turns out PT width produces rather good energy peaks. I've used these to select 14 keV peaks to calibrate PTOF (after linearizing). |
The table below summarizes the noise widths measured during this run under various conditions:
| Readout | Source position | Bias [V] | Bias polarity | Prebias | dP/dI [uV] | Noise width [eVee] |
|---|---|---|---|---|---|---|
| 2-sided | pF | 0 | n/a | n/a | 1.0 | 130 |
| side1 | pF | 20 | + | no | 1.0 | 18.7 |
| side1 | pF | 100 | + | no | 1.0 | 11.8 |
| side1 | pF | 150 | + | no | 1.0 | 16.9 |
| side1 | pF | 100 | + | yes | 1.0 | 8.1 |
| side1 | pC | 100 | + | yes | 1.0 | 6.5 |
| side1 | pC | 100 | - | yes | 1.0 | 7.3 |
| side2 | pC | 100 | + | yes | 1.0 | 5.18 |
| side2 | pF | 100 | + | yes | 1.0 | 8.1 |
| side2 | pF | 100 | + | yes | 0.9 | 5.53 |
| side2 | pF | 100 | + | yes | 0.7 | 4.7 |
| side2 | pF | 100 | + | yes | 0.4 | 8.56 |
Some observations:
- 100V seems to be better than 150V, though this is not certain (comparison only without prebias)
- There seems to be a sweet spot for dP/dI. The lowest value (highest gain) has worse noise width. Possibly because electrothermal oscillations get worse.
The same noise-width calculation technique was performed on background data from Run68 using S101. This is for the conditions that we decided were optimal. Results below:
| S101 noise width from Run68 | ||||||
|---|---|---|---|---|---|---|
| Readout | Source position | Bias [V] | Bias polarity | Prebias | dP/dI [uV] | Noise width [eVee] |
| side1 | pF | 125 | - | yes | vary with channel, 0.5-1.0 | 8.3 |
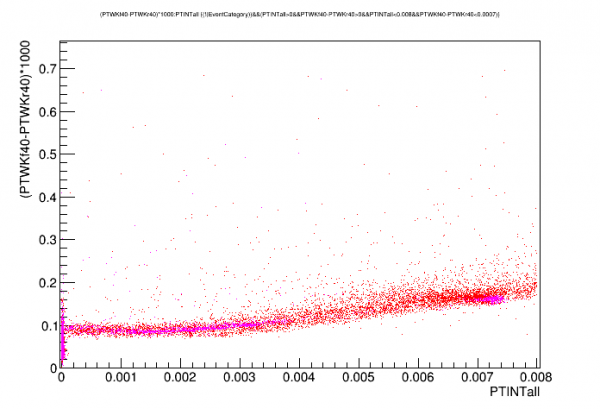
Interestingly the Run68 data shows much less pulse-widening in the 0-20 keVee range. Why is this? Tc's and Rn's are about the same.
| S104, this run, 100V | S101, Run 68, 125V |
|---|---|
| |  |
Tower Thermometer versus Goldman Thermometer
As in previous runs the Tower Thermometer (connected to the fridge wiring) read anomalously high. The Goldman thermometer (connected to stripline wires) seemed to read correctly. The spreadsheet below compares the two thermometer readings taken at the same time once a day.
temerpature_comparisons.xlsx