Charge collection efficiency based on muons
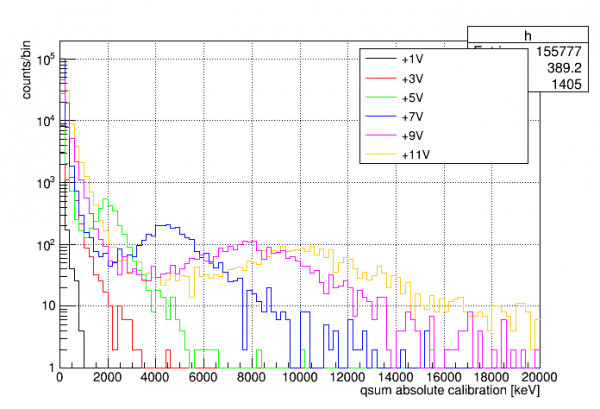 | 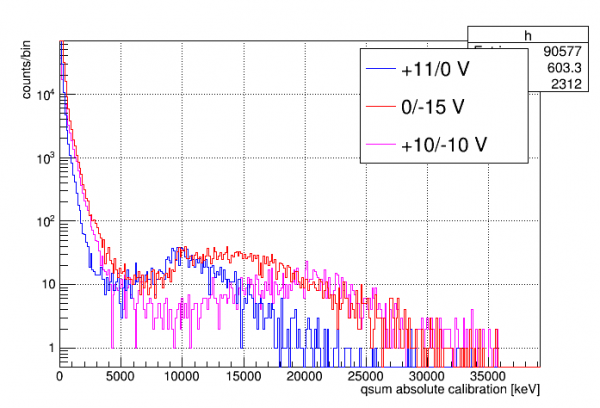 |
The plots below show how the muon bulge appears at different positive biases. At first we biased only with the DCRCs (Side1), then we started using the external HV supply (Side2) to get higher biases.
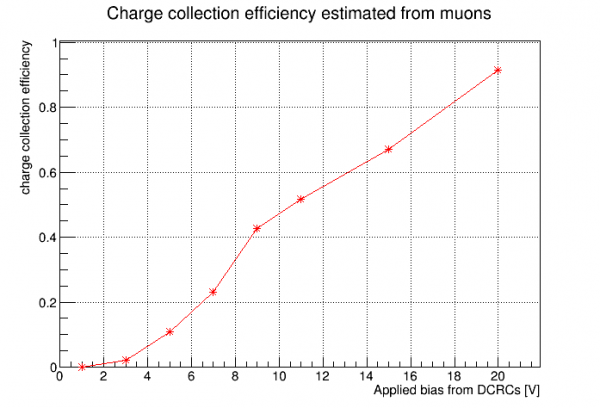
Below is an approximate charge collection efficiency curve based partially on the absolute calibration and the expected muon deposited energy spectrum. It's rescaled to the result from Run 67 (taken at 4K), with the assumption that we had 100% CCE at that time.
Time-dependent gain plots
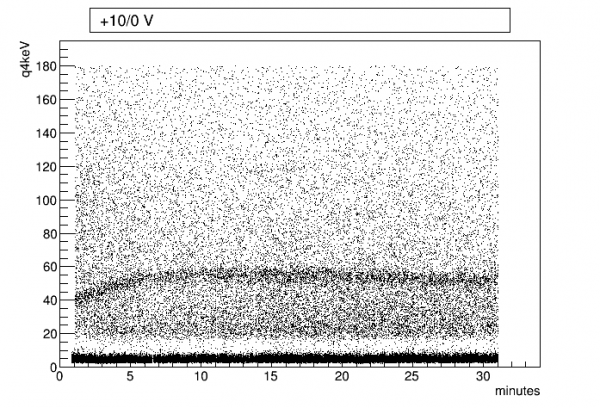
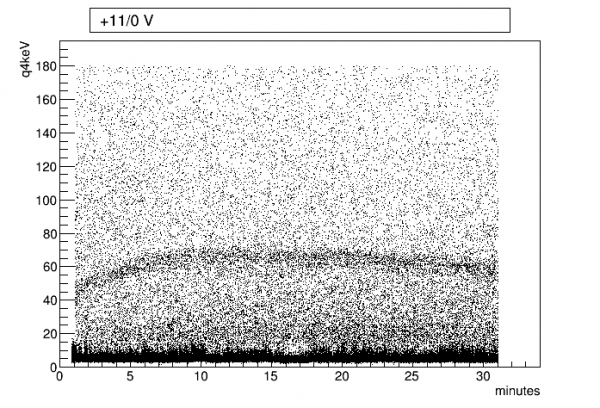
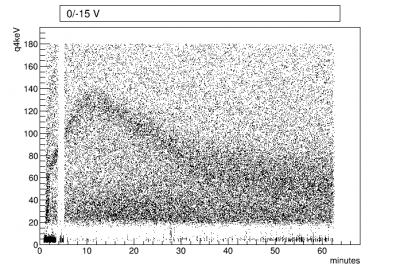
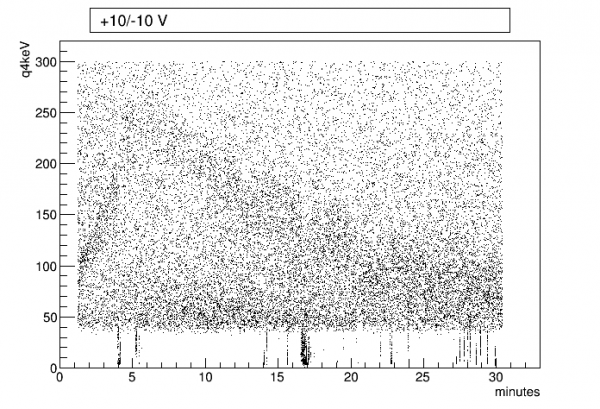
Below are plots of the time variation in the 60keV peak at different positive biases.
 |
 |
 |
| note change in y-axis scale in plot below |
 |