Table of Contents
Run 68, Pulse BS subtraction
Data taken with high event rates will often include many pulses on elevated or sloped baselines. This can be problematic because the TES will be effectively biased away from it's quiescent position, changing the dP/dI value. These effects can perhaps be calibrated out. It also presents a practical difficulty when employing pulse fitting algorithms. Most of the methods currently used assume a pulse shape sits on an otherwise flat baseline. A sloped baseline can cause issues e.g. when the DC offset is subtracted (required for SQUID-based sensors) or when trying to find the pulse start time. In short, a sloped baseline can cause biases in calculated pulse amplitude and time if the algorithm used assumes a flat baseline.
Sloped BS subtraction
Some work has been done to remove OF timing bias by subtracting the sloped baseline before running the OF algorithm.
Slope BS fitting
Another possibility is to fit the baseline as well as the pulse. It was suggested that this could be accomplished with the OF1X2 (2-template) algorithm. To test this idea, a set of templates were constructed using r68 data. The templates are the same as the v5 templates described here, except their “fast” templates were all a linear shape with offset of 0 and slope of -1/(pulse length). I.e. they were 0 at the beginning of the trace and -1 at the end of the trace. These templates were then used to process a small amount of -125V 22Na and PuBe data.
The plots below show some interesting observations of this data. At energies above ~200 eV, the two algorithms return very similar PT amplitudes, above a few keV they are basically identical. But with the 2-template using a linear “fast” template, the noise wall of triggered data becomes unbiased from 0. This has the result of lowering the noise wall level when calibrated using ~15 keV lines. This can be seen in the spectra below. Here the “OF” spectra are constructed from the “PTOFamps” quantity and the “1×2” spectra are from the calibrated “PTOF1X2Pamps” quantity, the amplitude of the “slow” or “primary” template.
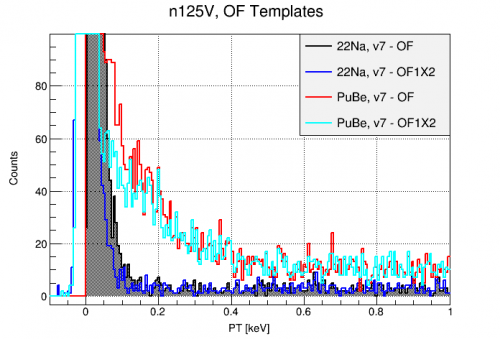 |
| Low energy spectra using single template (OF) and 2-template OF with linear “fast” template to fit sloped bs (OF1X2) |
This seems good at first blush. Maybe slight slopes in baseline were being incorrectly fit with some positive amplitude with the single template, but are found to be more like 0 after the baseline slope is removed? However, if we also plot the average channel baseline slope of each (22Na) event as a function of these same PT energies, it is clear that the shift of the noise wall from baseline is uncorrelated with baseline slope. For scale, a 60keV event amplitude is about 100 ADC units.
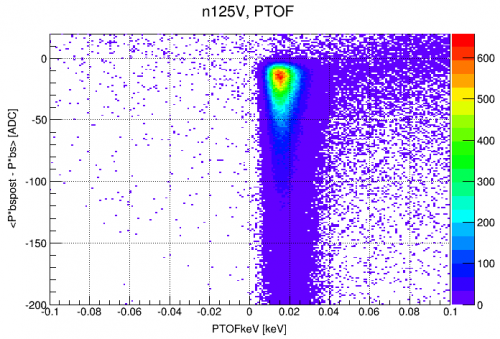 | 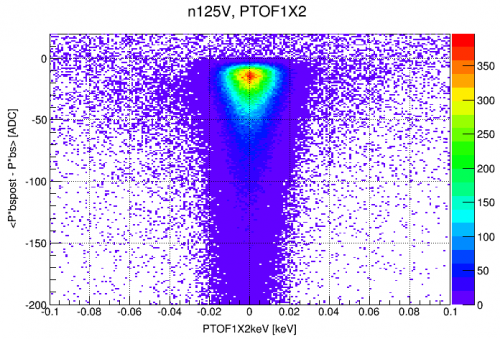 |
| Average baseline slope of 22Na data as a function of measured energy using Left: single template OF and Right: 2-template Of with linear “fast” template. | |