−Table of Contents
R68 Noise Stability
Noise Width from PSDs
R68 data was taken over several months and in may different operating conditions. This is an analysis of the noise of the -125V data. In that dataset, there were 193 background, 535 Na, and 640 PuBe series included in the final analysis. Each series was 10 min long including randoms.
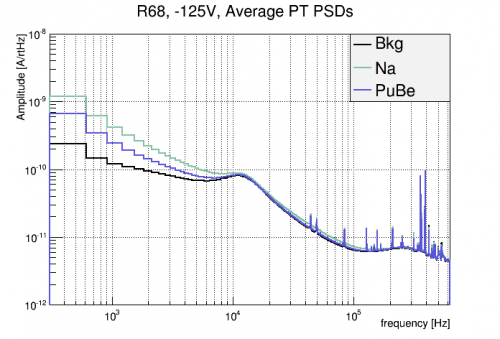
The PSD of pulse-less randoms was calculated by BatNoise for each series. The resulting PT PSDs were averaged for each data type and are shown below. Interestingly, the Na data, which had the highest rate, appears to have the highest low-frequency noise. This is likely due to more frequent sloped baselines in the pulses. Note that these PSDs are in the same units as PTOFamps, which is to say it is NOT the current through the TES, but something proportional to it due to incorrect factors in the cdmsbats processing files.
 |
The theoretical optimal filter resolution can be used to compare noise levels from each series. It can be calculated from the noise psd, J(f), and OF template, s(f), as
.
(Notes on discretizing this calculation and rectifying FT conventions can be found here)
We can now compare this resolution across the different data types and series. The calculated resolutions are again in the same units as PTOFamps. The mean resolutions for bkg, Na, and PuBe data were 8.79 nA, 14.6 nA, and 11.4 nA respectively.
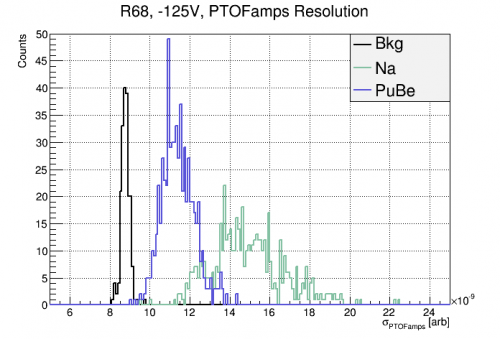 | 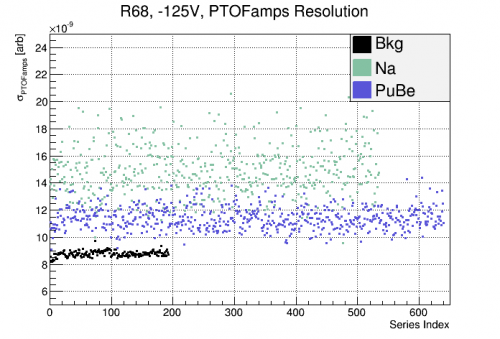 |
Using these values, we can generate a list of the noisiest series. In PuBe data, the series with resolutions more than 3σ above the mean were:
//> 3-sigma
07180925_1410
07180927_2148
07180928_1913
07180929_0918
07181002_2002
07181003_0152
and those with resolutions 2σ above the mean were:
//> 2-sigma
07180923_0102
07180923_0436
07180923_0456
07180923_0617
07180923_1622
07180923_1905
07180925_0335
07180925_1410
07180927_1827
07180927_2148
07180927_2158
07180927_2208
07180927_2359
07180928_0030
07180928_0300
07180928_1913
07180928_2102
07180929_0559
07180929_0827
07180929_0918
07180929_1206
07180929_1445
07180930_0046
07181002_2002
07181003_0011
07181003_0152
07181003_0452
07181003_0741
07181003_0940
Noise Width from Randoms
A comparison was next made to the observed noise in each PuBe series. This was done by fitting the width of the PTOFamps0 distribution of randoms triggers in each series. The fitted widths are compared to the theoretical widths (as calculated above) in the figure below. There appears to only be a weak correlation between the two measures. There are some outliers in the measured quantity which are likely due to poor fits obtained form the automated fitting procedure. The rest of the poor agreement may be due to the selection of events which is used by the BatNoise algorithm to produce the PSDs used in the theoretical calculations.
At any rate, we can use these two measures to select series which are noisy according to both measures. This is defined as those series for which both measures of <m>\sigma_{PTOFamps}</m> are more than one standard deviation above the mean value for that measure. These are the series in red.
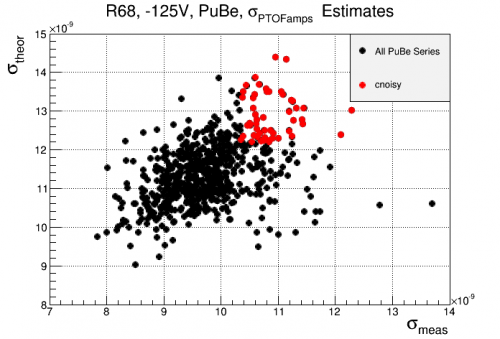 |
| Comparison of theoretical and observed noise in PuBe randoms. |
|---|
Effect of Noisy Series Cut
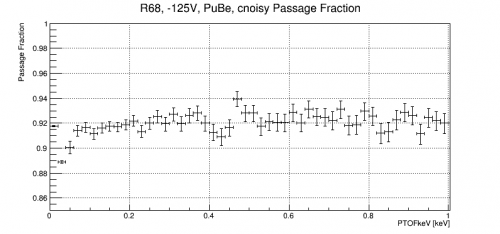
Spectra were produced using the full R68 data set, with all the standard cuts and both with and without these noisy series removed. The resulting spectra and passage fraction are shown below. There is no obvious structure uncovered in the (n,gamma) signal and the passage fraction is quite flat above the noise wall. So removing these series seems to just be an effective livetime cut with no clear improvement in signal. This is not surprising as the noise measures are generally stable to within 5%. For these reasons there seems to be no reason to apply a noisy series cut such as this in the final analysis.
 |
 |