Table of Contents
Resolution and Threshold
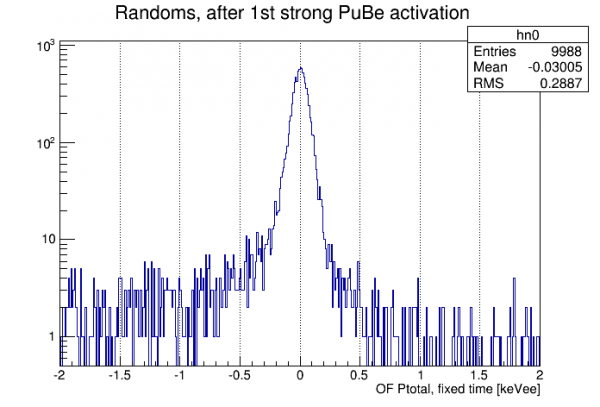
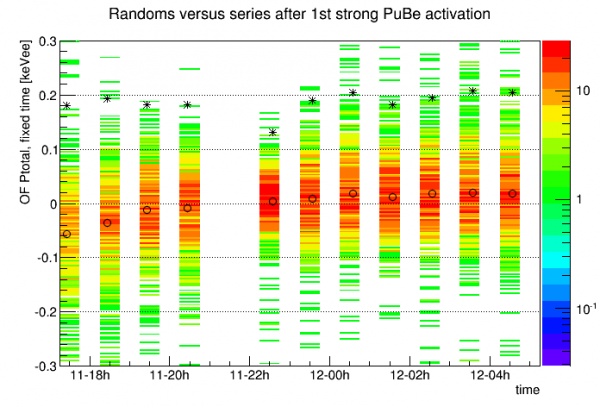
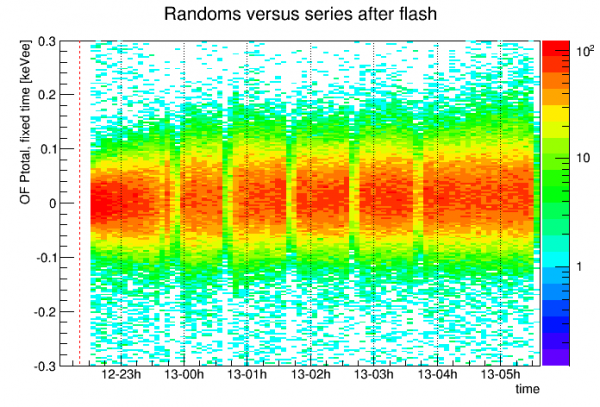
Calibration drift
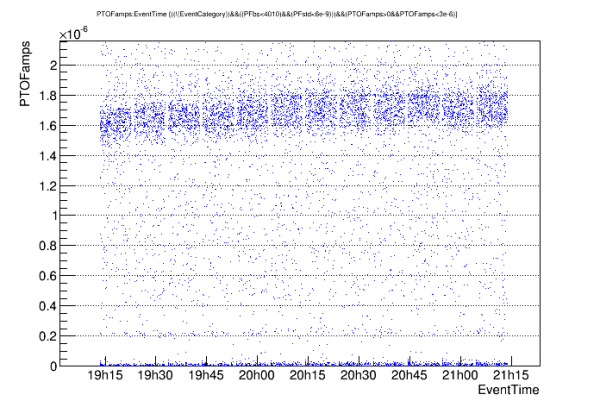
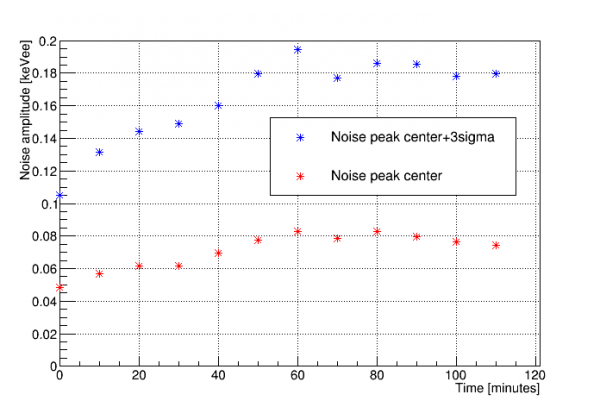
Noise Threshold versus time

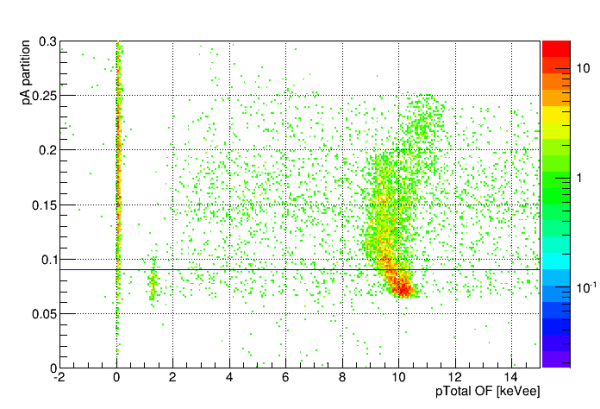
P-Inner Cut
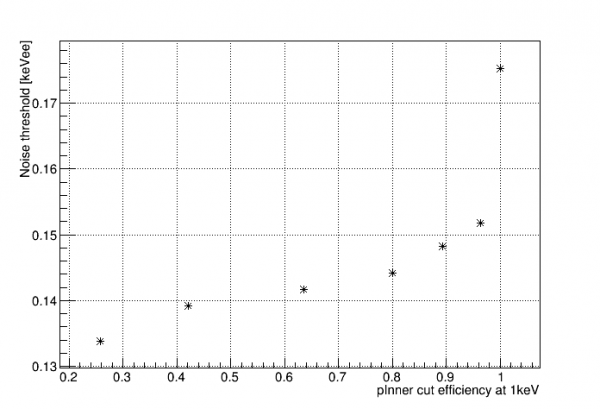
Noise Threshold with P-Inner Cut

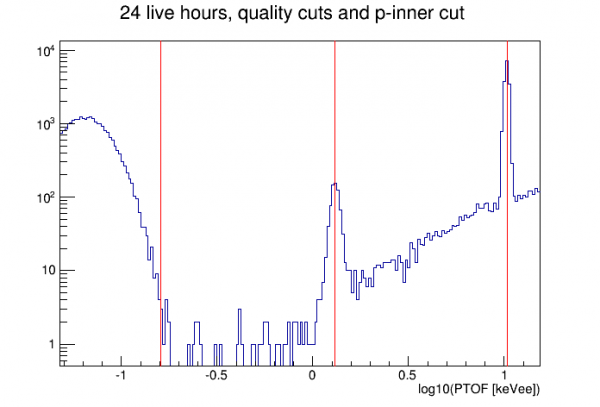
Cleaned up spectra
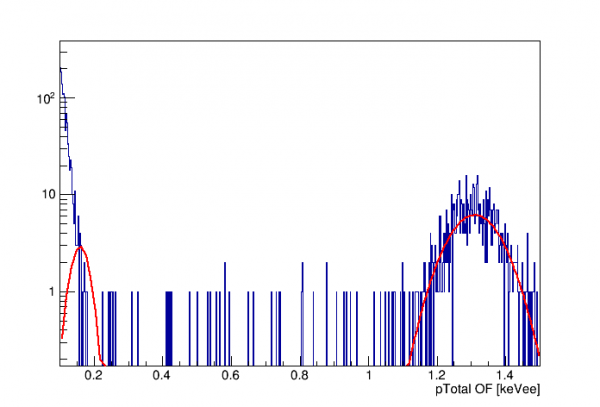
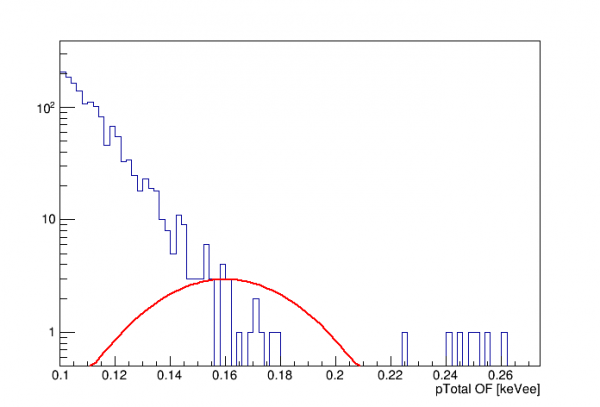
Threshold vs. Bias
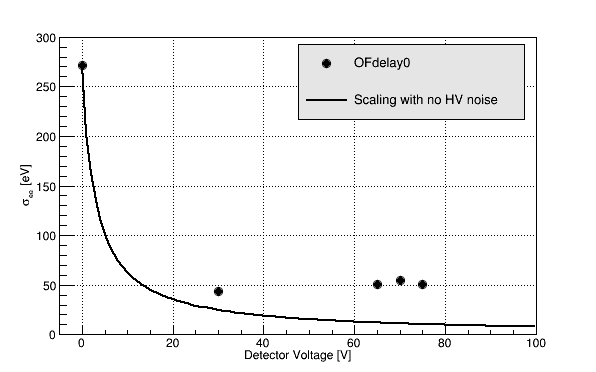
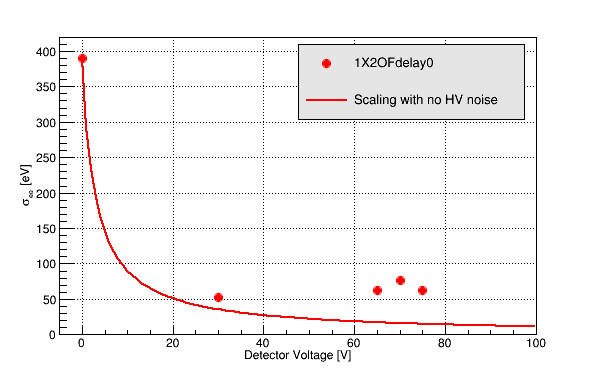
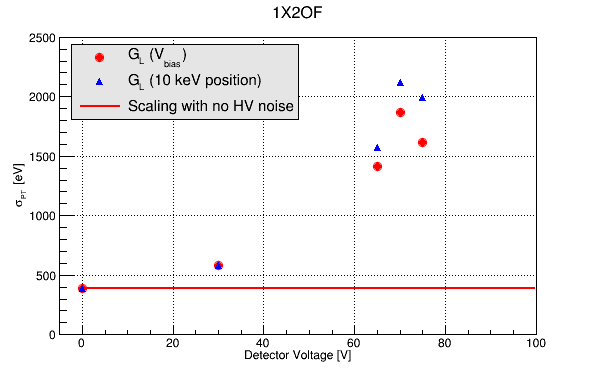
The following plots are based on the HV scan data taken on 2017/12/14. Each data set is calibrated to keV_ee using the 10.37 keV activation line using both single template optimal filter (OF) and 2 template optimal filter (OF) quantities. Then the 1-sigma width of the 0-delay distribution for the randoms is measured using each quantity. This is a measure of the 0 energy (baseline) resolution of the detector. The plots below show this noise in both keV_ee and keV_tot.
Note: Channels PA and PF were railed for the 65 and 75 V series respectively. A scaling based on the channel relative calibrations was applied to account for this (missing PA = 1.21, missing PF = 1.13).
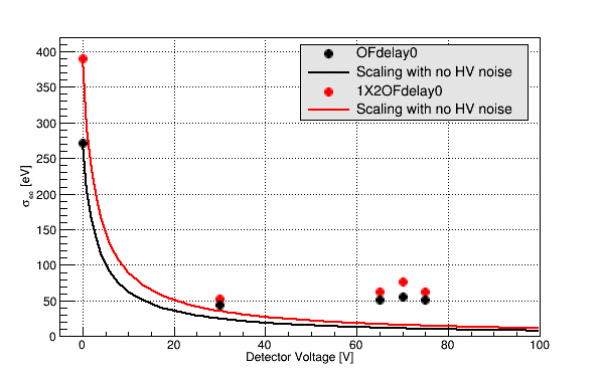 |
| The electron-equivalent 0 energy resolution as a function of HV bias. Naive scaling of 0V noise levels are also shown for comparison. The single template OF generally finds lower baseline resolutions than the 2-template OF. |
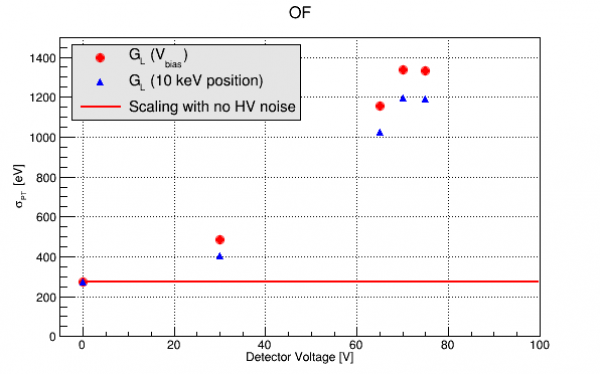 |
| Total phonon energy resolution as measured by single template OF as a function of HV bias. Again, 0V noise scaling is shown. |
Links to related plots: sigmaee_of_v_bias.png sigmaee_1x2_v_bias.png sigmapt_ofkev0_v_bias.png sigmapt_1x2kev0_v_bias.png
These results can be compared to those obtained in the previous run with this detector using higher Rsh, Run61. Note that PA was not operated for R61, so the same correction described above has been applied to the R61 data.
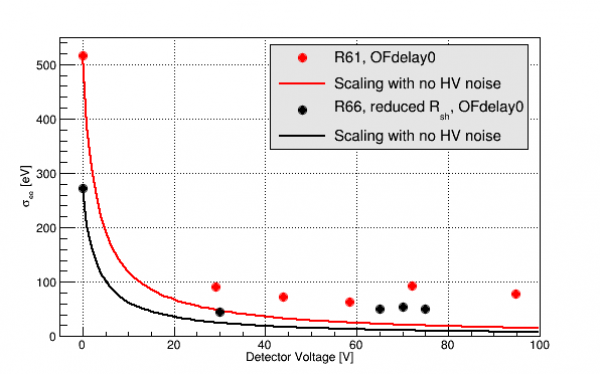 |
| Comparison of sigma ee for the last two runs of detector HV2. Note the reduction in 0V energy resolution as a result of lowering Rsh. |
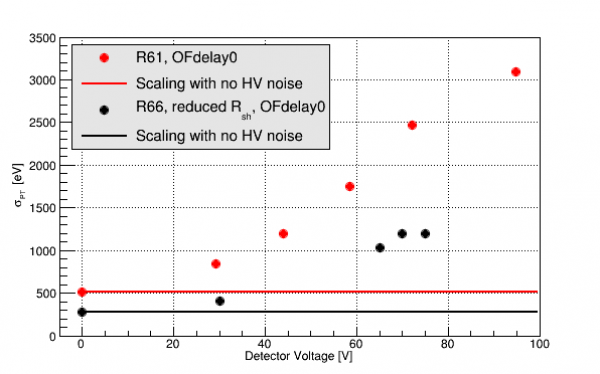 |
| Comparison of sigma PT for the last two runs of HV2. Both the 0 V and HV noise have been reduced this run. |