Table of Contents
Comparing Rshunt, Run 61 versus Run 66
Front-end gains all set to 10
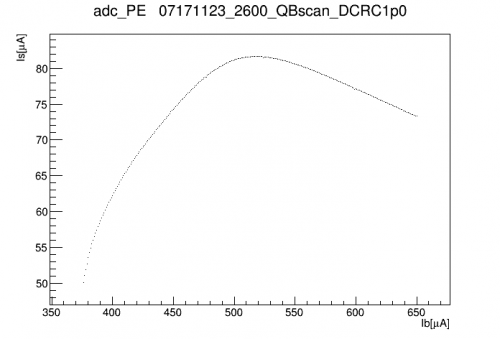
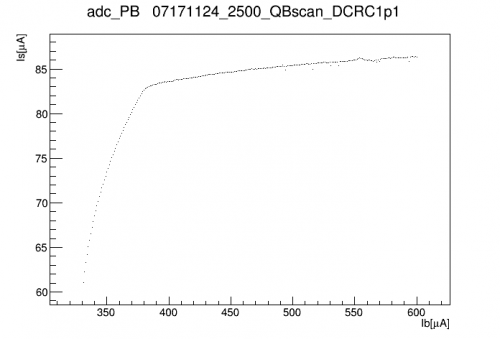
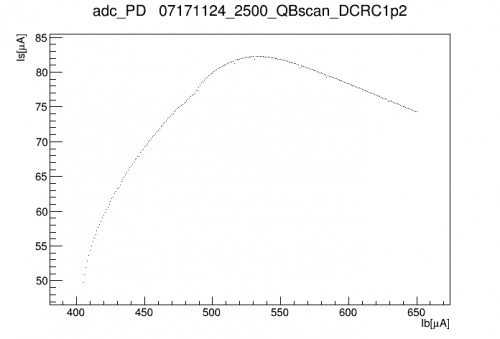
| IbIs curves at 0V, calibrated but not offset-corrected | ||
|---|---|---|
 |  |  |
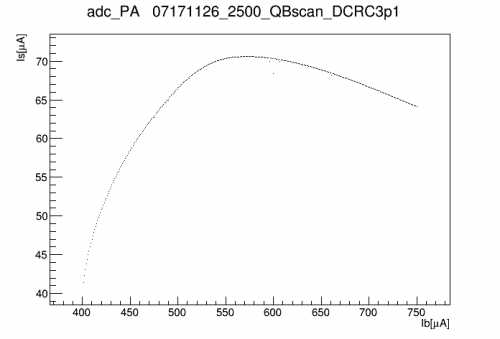 | 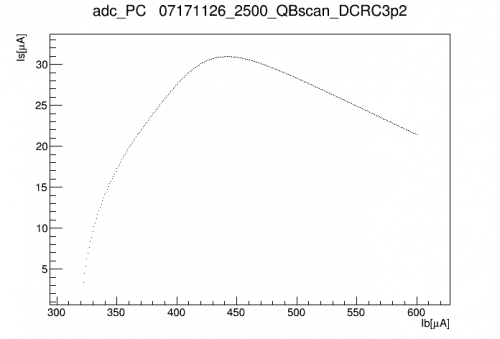 | 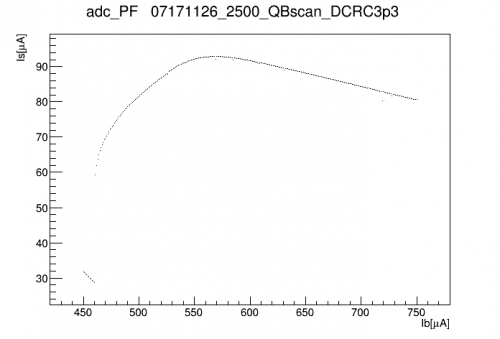 |
| In most cases the channel railed when it dropped into superconducting: these points are not shown. DCRC3pD is an exception. DCRC1pB is behaving strangely. It seems as though no matter how high the bias it can't be driven into its normal state. |
||
The normal part of the curve can be extrapolated back to find the offset in Is. The slope of the normal portion can be used to find (R_n + R_par)/R_shunt. The superconducting falloff point can be used to estimate R_par/R_shunt. We can compare with Run 61 measurements to see the effect of reducing the shunt resistances.
| Run 61 | Run 66 | Based on Rsh ratio | ||||||
|---|---|---|---|---|---|---|---|---|
| DCRC chan | Det chan | Rpar/Rsh | Rn/Rsh | Rpar/Rsh | Rn/Rsh | Rsh ratio based on Rn | Rsh + Rshp [mΩ] | Rshp [mΩ] |
| DCRC1pA | Side1 pE | 0.38 | 3.779 | 1.154 | 10.732 | 2.84 | 8.451 | 1.785 |
| DCRC1pB | Side1 pB | 0.729 | 5.167 | |||||
| DCRC1pC | Side1 pD | 0.531 | 3.125 | 1.42 | 9.923 | 3.175 | 7.559 | 0.892 |
| DCRC3pB | Side1 pA | 0.47 | 4.308 | 2.005 | 16.453 | 3.819 | 6.285 | -0.382 |
| DCRC3pC | Side1 pC | 0.372 | 4.413 | 1.432 | 11.887 | 2.694 | 8.909 | 2.243 |
| DCRC3pD | Side1 pF | 0.569 | 3.4 | 1.869 | 10.4 | 3.059 | 7.846 | 1.179 |
The table above compares the measured Rp/Rsh and Rn/Rsh from Runs 61 and (current) 66. Rn is not expected to change (detector property), but Rpar might (SQUET property). The ratio between Rn/Rsh measurements in the two runs is not quite constant. It's close to 3, as expected by the shunt reduction. If we use the standard assumption that in an unmodified SQUET, Rsh = 20 mΩ and Rsh_par = 4 mΩ, we can calculate Rsh+Rsh_par in the current run per channel, then subtract the assumed Rsh = 6.67 mΩ to find the new Rsh_par. This varies significantly.
One channel is an outlier, with a too-low implied Rsh+Rsh_par. Below we fit the ratios with and without the outlier.
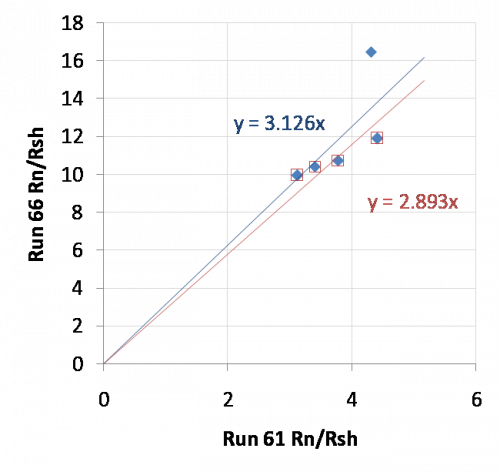
If we look at the Rpar/Rsh(tot) values, we see that the before-and-after values show no correlation, as expected. But the relative scatter across Rpar values is the same in both cases. The ratio of the Rpar/Rsh means between Run 66 and Run 60 is 3.08.
In general the ratio of the old Rsh_tot to the new Rsh_tot seems to be close to 3.0. There is variation in this ratio but that could be either variation in the original shunt resistances or variation in the new ones. We don't know which, so it makes sense to assume a standard Rsh_tot in this case as was done in the previous case. The previous standard was 24 mΩ so the new standard will be taken to be 8 mΩ.
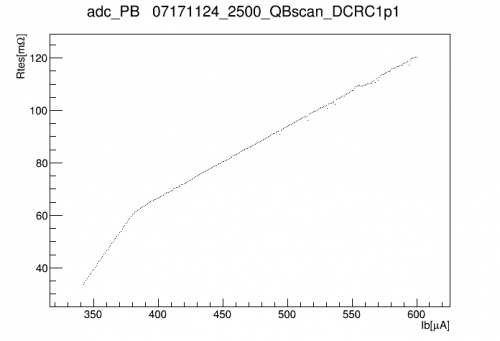
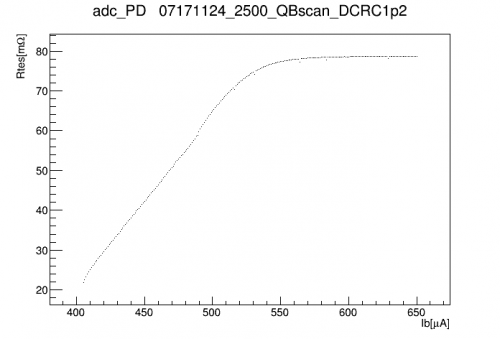
TES resistance curves
 |  |  |
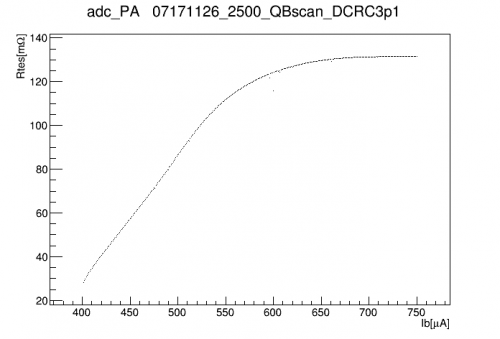 | 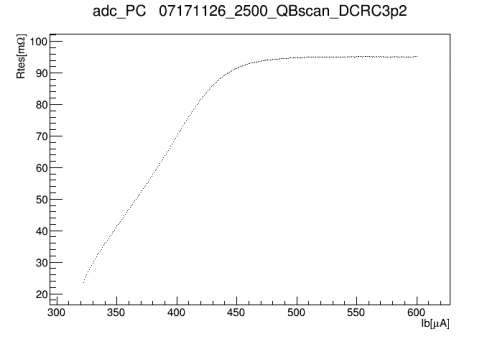 | 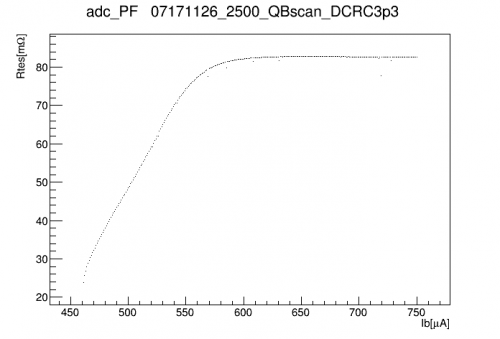 |
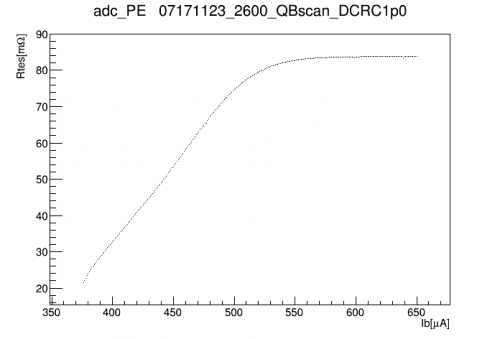
| With DCRC1pB we have guessed at its parasitic resistance in order to extract the I_s offset from the transition-to-s/c falloff point. | ||
The plots above show the TES resistance in the transition and normal regimes. There is a wider possible range now for selecting a bias point (the lower limit of the resistance is set by Rshunt+Rpar, previously around 40 mΩ, now around 20 mΩ).
Oscillation regions
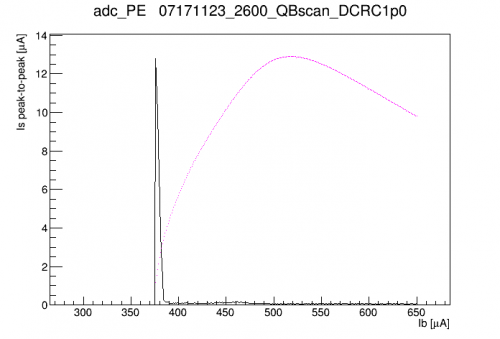
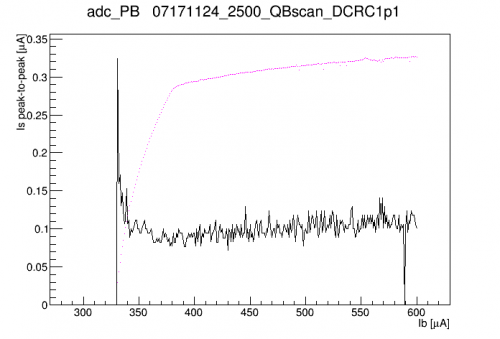
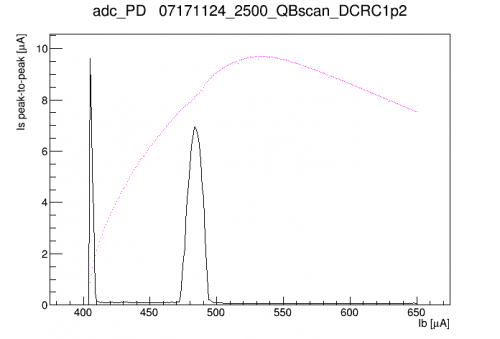
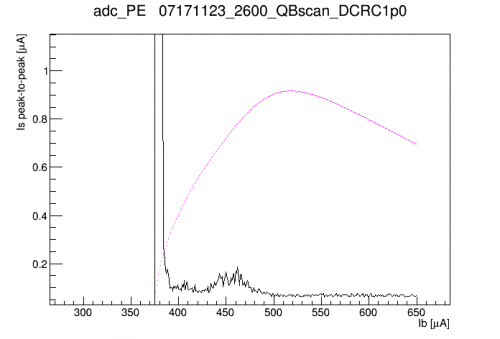
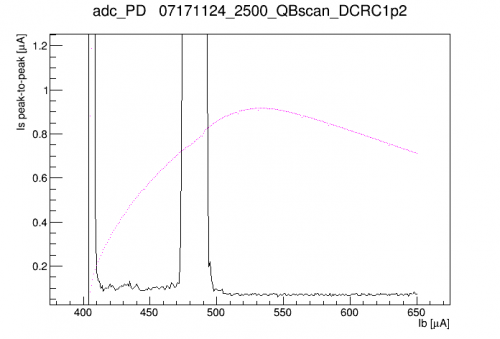
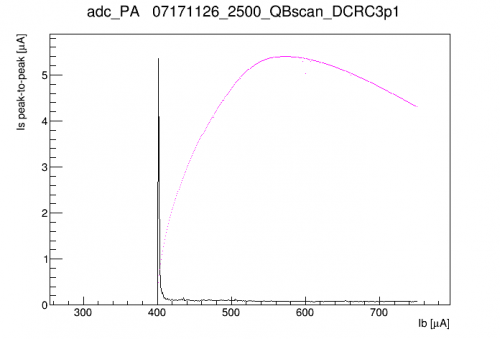
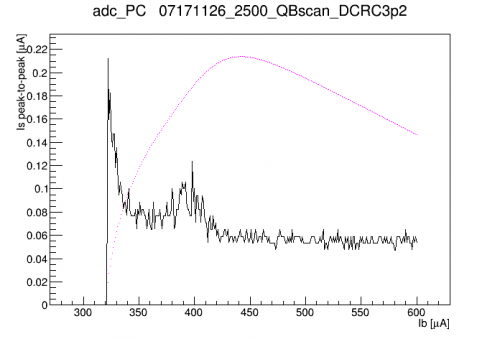
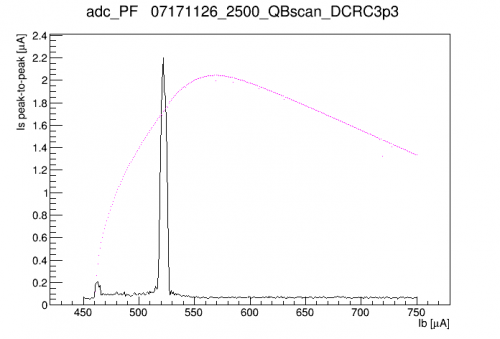
As in Run 61 we see certain regions in the transition where the signal shows a strong electothermal oscillation around 12-13 kHz. Using the IbIs data I looked for these regions by calculating the persistent peak-to-peak width of the baseline at each QET bias point. Plots below:
 |  |  |
 |  |
|
 |  |  |
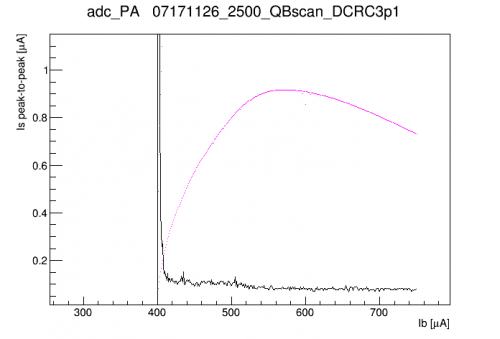 |
The IbIs curves are scaled and superimposed in magenta. For channels with very strong oscillations I show a zoomed version as well to see the smaller amplitudes. All channels show wide regions in the transition where oscillations can be mostly avoided.
After choosing 70V as a standard bias we recalculated IbIs and set new standard QET biases. Two channels, DCRC1pC and DCRC3pD, are set in their transitions below oscillation regions. Sometimes they seem to be pushed into oscillatory behavior by events. Below are plots for these two channels:
| Oscillation regions at HV = 70V | |
|---|---|
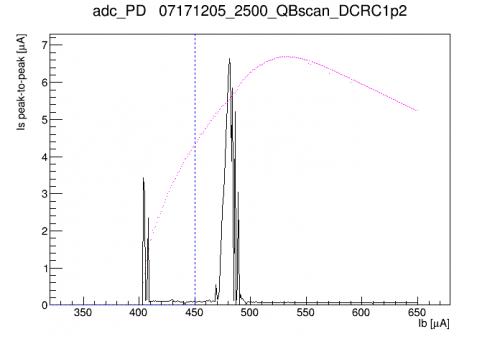 | 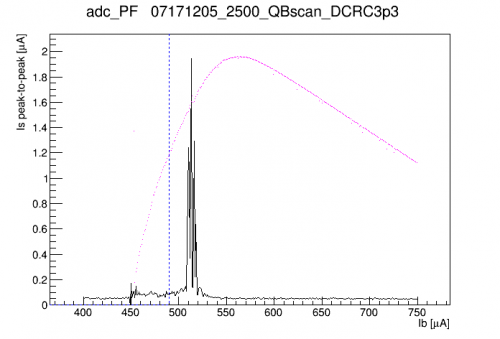 |
| Blue lines indicate current choices for standard QET bias. | |
HV = 0V versus HV = 45V
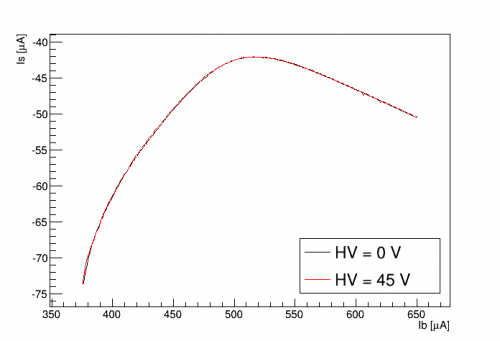
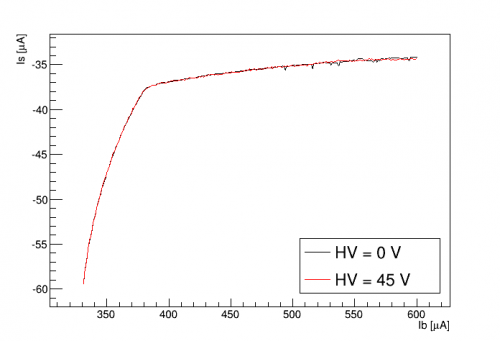
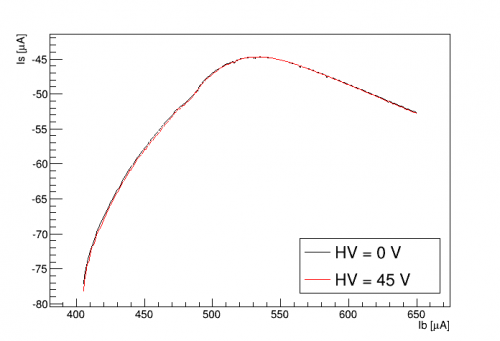
We have seen in the past and in this run that applying HV to this detector introduces parasitic power to the phonon channels, which is expected to alter the IbIs. Here we compare:
| IbIs curves at 0V versus 45V | ||
|---|---|---|
| DCRC1pA | DCRC1pB | DCRC1pC |
 |  |  |
| DCRC3pB | DCRC3pC | DCRC3pD |
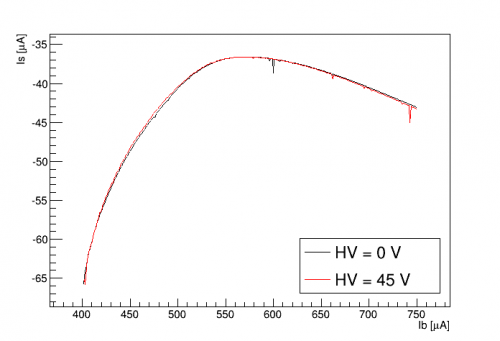 | 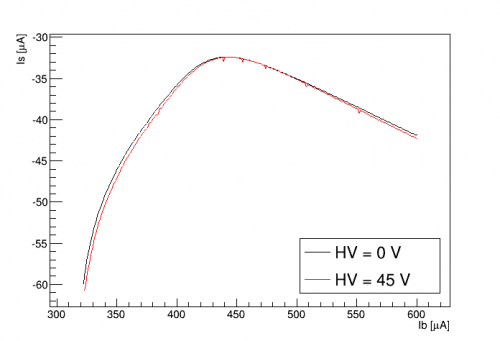 | 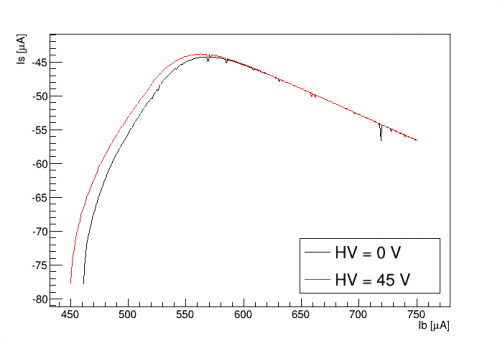 |
For many channels the IbIs looks nearly identical at 0V versus 45V. In DCRC3pC there seems to be an overall scaling difference. The only channel that seems clearly affected by parasitic power is DCRC3pD - this is Side1pF, the center channel.
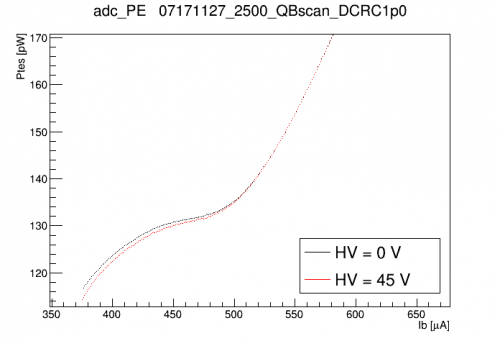
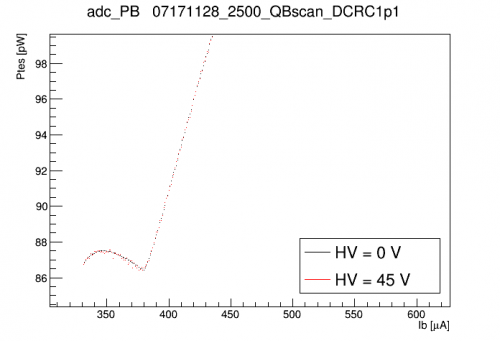
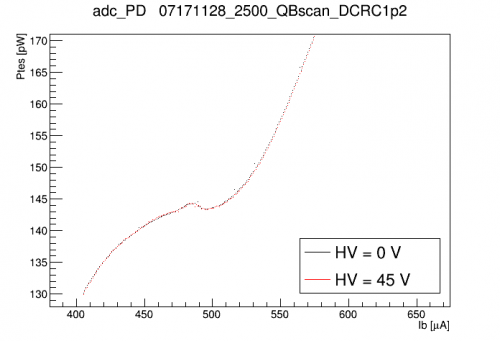
Differences can be more clearly seen by directly plotting the TES power:
| TES power curves at 0V versus 45V | ||
|---|---|---|
 |  |  |
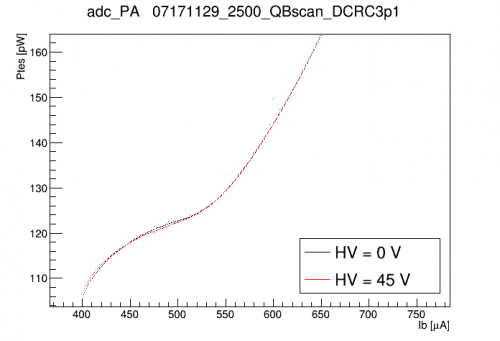 | 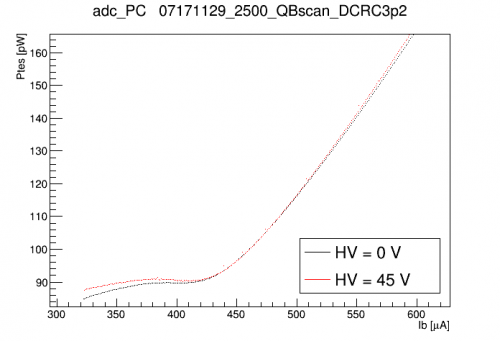 | 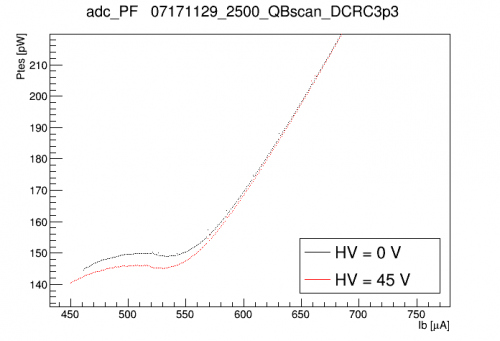 |
DCRC3pD (center channel pF) shows the strongest change in power from 0V to 45V, implying a parasitic power around 4 pW (about 3%). DCRC1pA (one of the inner ring channels) shows about a 1 pW (< 1%) parasitic power. Other channels show no apparent change in parasitic power from 0V to 45V.
dP/dI calculations
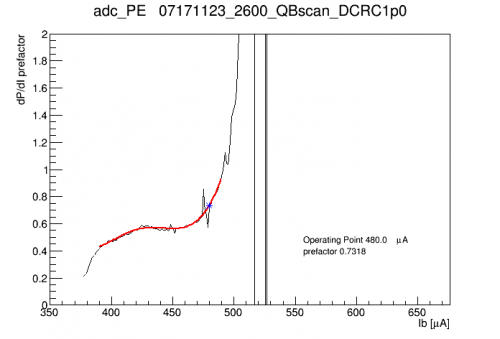
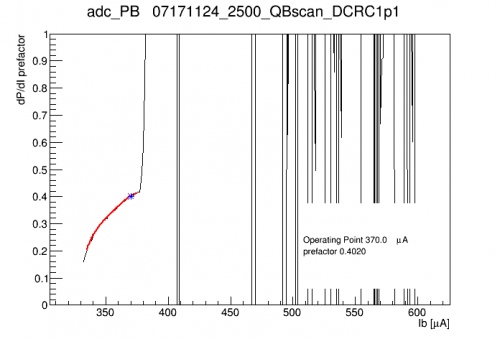
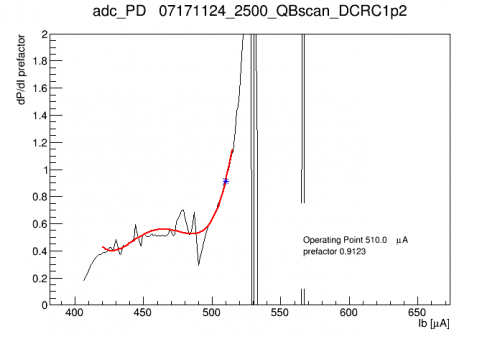
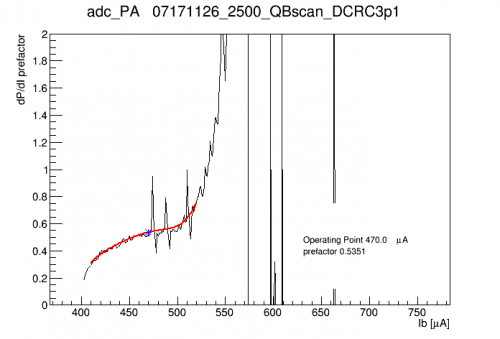
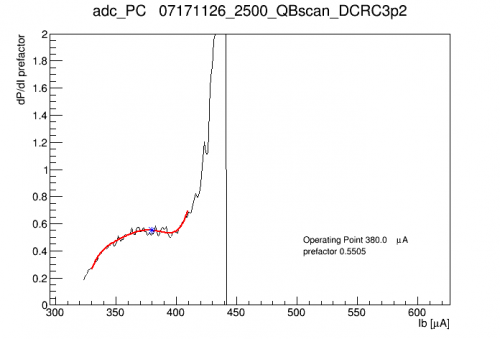
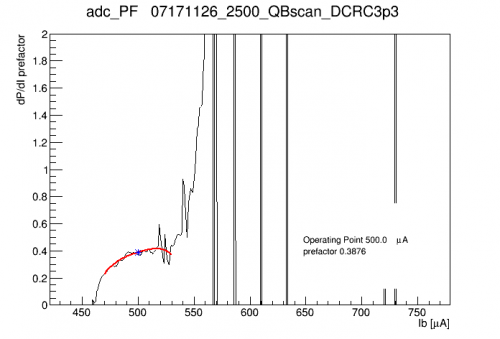
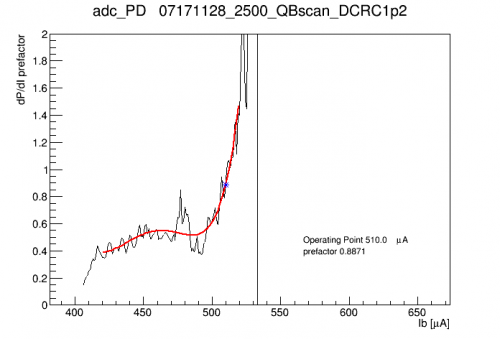
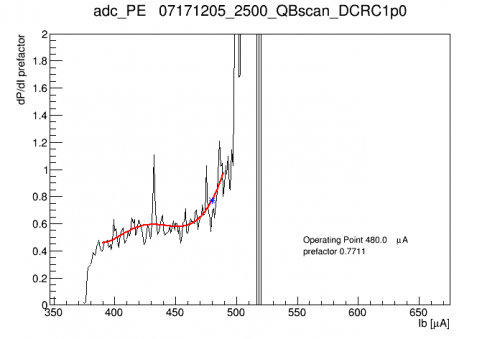
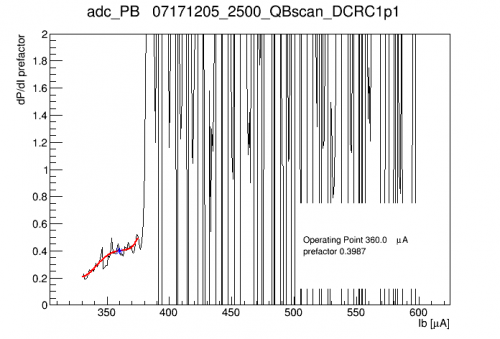
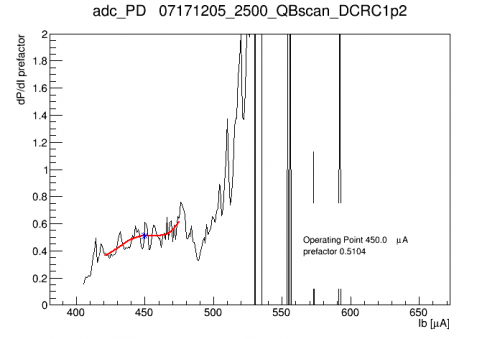
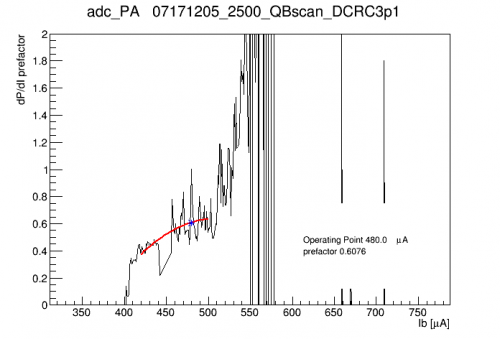
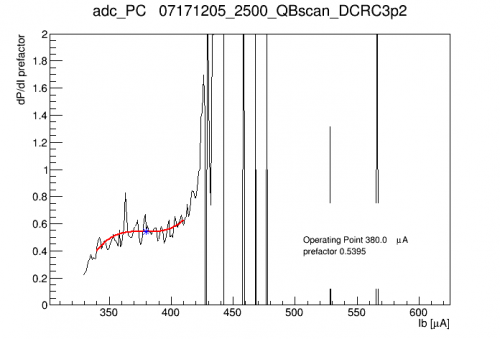
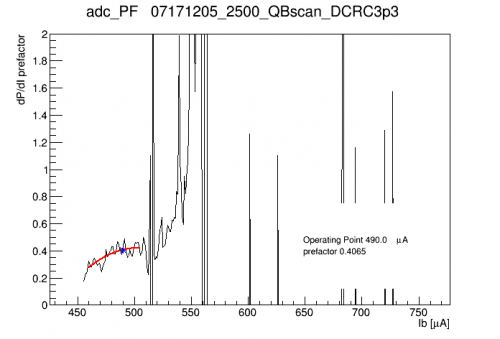
The absolute calibration of the TESs depends on calculating dP/dI. This is the product of the shunt resistance, the bias current, and a prefactor calculated from the IbIs curves. Below are prefactor curves with calculation for a set of operating points we selected early in the run.
| dP/dI prefactor curves at 0V | ||
|---|---|---|
 |  |  |
 |  |  |
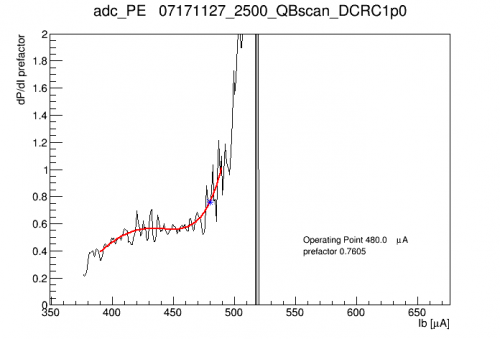
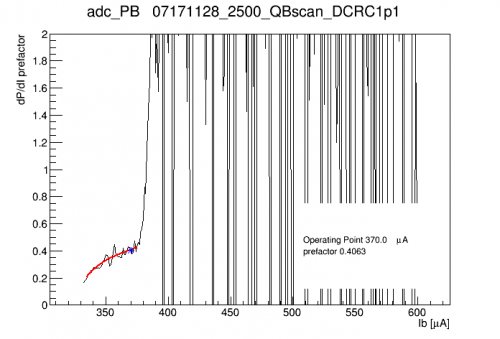
Below are the dP/dI curves for the 45V IbIs data:
| dP/dI prefactor curves at 45V | ||
|---|---|---|
 |  |  |
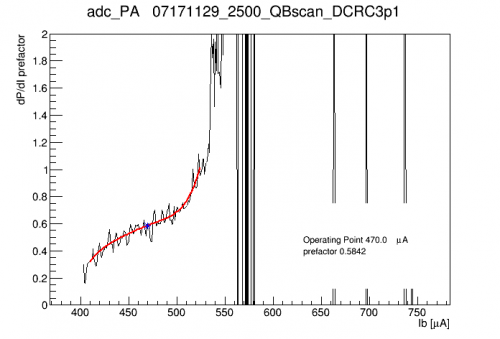 | 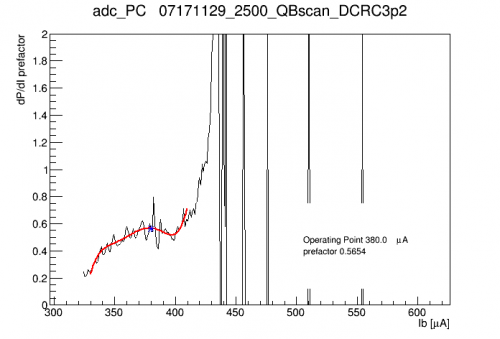 | 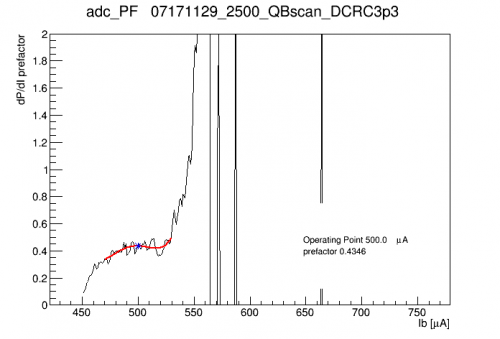 |
Most of the prefactors are higher in the 45 V case (implying lower TES gain, which is probably expected if there is increased parasitic power). The greatest change is, again, DCRC3pD (pF, center) with an increase in the prefactor of 12%. The average increase is 4-5%.
| dP/dI prefactor curves at 70V | ||
|---|---|---|
 |  |  |
 |  |  |
IbIs for Side2 channels, with shorted Rshunts
On January 3rd we removed the HV box and connected the detector DIBs directly to the DCRCs, so we could check the Side 2 channels at 0V bias. Two of these channels, Side2pB and Side2pE, had shorted Rshunts, so the effective Rshunts would only be the “parasitic” resistances from the wirebonds. The two were wired differently: pE was shorted across the leads, so that the resistance was from a single bond pair, and pB was shorted across the resistor, so that the resistance was from three bond pairs in series.
Performing IbIs on the channels, we found that Side2pE (with the lower single-bond resistance) could not be driven out of superconducting even at the highest QET bias of 1 mA. Side2pB (with the higher triple-bond resistance) could be put into transition, but not driven into its normal state. A manual IbIs curve was taken, shown below:
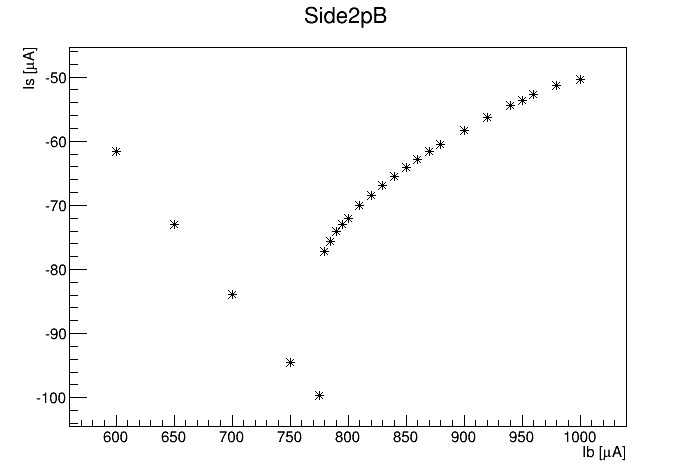 |
If we had the normal part of the curve we could use it and the previously measured normal resistance. Since we don't have the normal part we can instead make an estimate based on the superconducting part of the curve and a guess at the parasitic resistance based on previous averages. This gives an uncertainty of about ±30%. The estimate is Rshunt ≈ 3.5 mΩ.
Using this estimate we can plot the TES resistance and power versus QET bias, and we get plausible results:
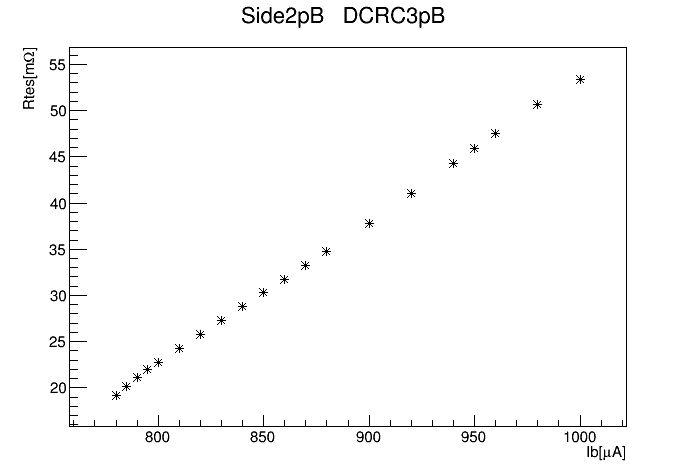 | 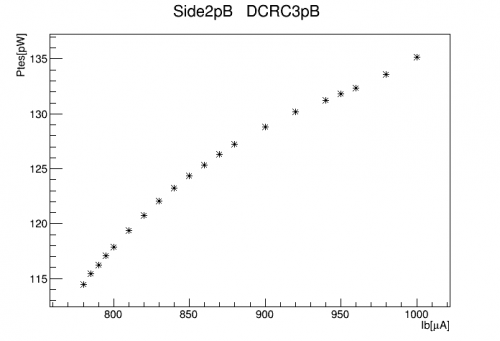 |
| R_normal for this channel is about 90 mΩ, so we are getting only about half the transition. It looks like if we could raise the QET bias to 1.4 mA we could see the full transition. |
|
As with other channels there are regions with 13 kHz oscillations. The amplitude of the oscillation is shown below, with the IbIs curve superimposed in magenta:
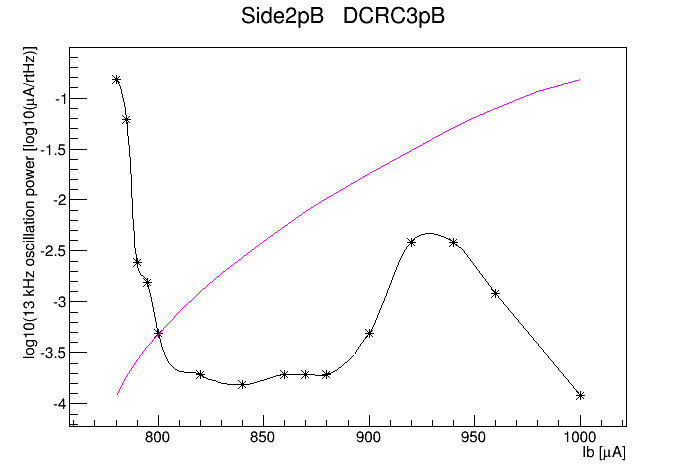 |
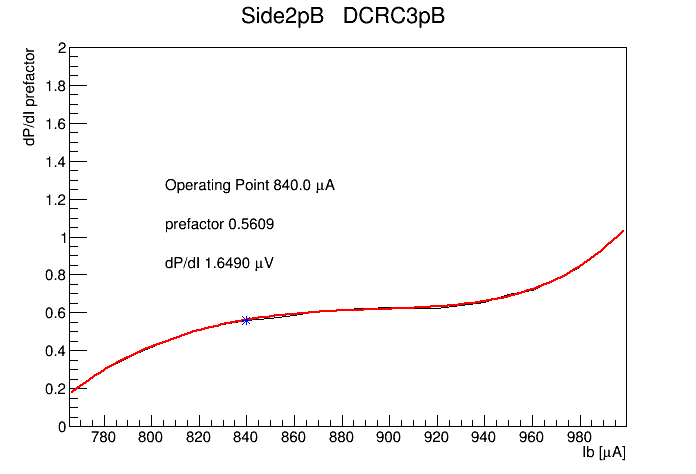
Based on the above plots we set a standard operating QET bias of 840 μA. The prefactor and dP/dI calculation are shown below:
 |
As for Side2pE, we can also estimate the Rshunt value based on the superconducting part of the IbIs curve and assuming the channel has an average parasitic resistance. The result is Rshunt ≈ 0.9 mΩ. This is the channel with a single wirebond pair, so we may expect this to be about 1/3 the 3-bond-pair case, and it is indeed close, within the ±30% error.