Table of Contents
Early phonon collection efficiency versus magnetic shielding results
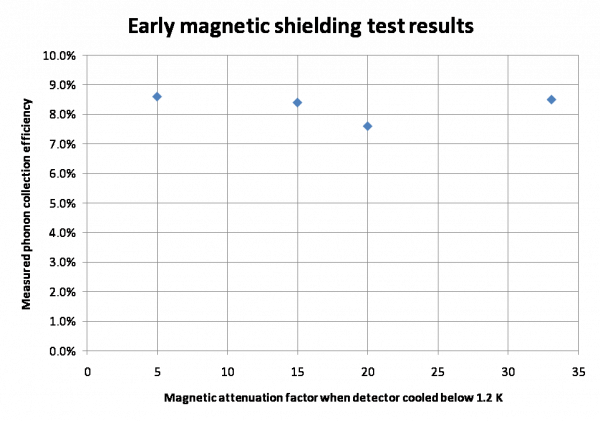
magnetic_shielding_and_qets_atumnk100_run59.pdf
Luke gain check
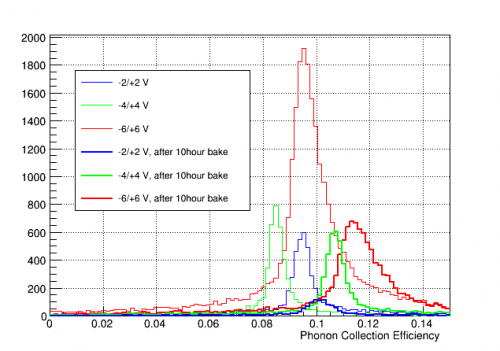
We took data at various biases to check whether the Luke gain comes out as it should. We used -2/+2 V, -4/+4 V, -6/+6 V which should produce Luke gains of 2.33, 3.67, and 5.00 respectively. Total phonon amplitude divided by calibrated charge energy should appear in these ratios. The plot on the left shows the result. The plot in the middle shows the result after a 10 hour bake. These plots both use integral quantities (INT) for the phonons; the rightmost plot uses optimal filter (OF) quantities and should be disregarded, since larger phonon pulses are also more saturated and shaped differently, so that the OF quantities at different biases are not comparable.
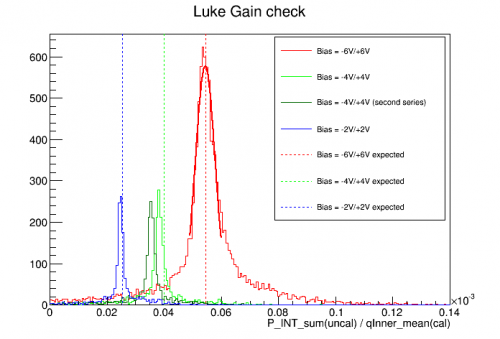
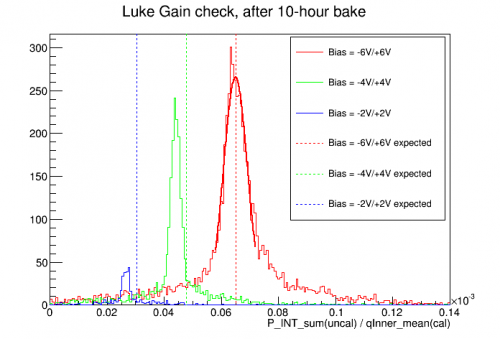
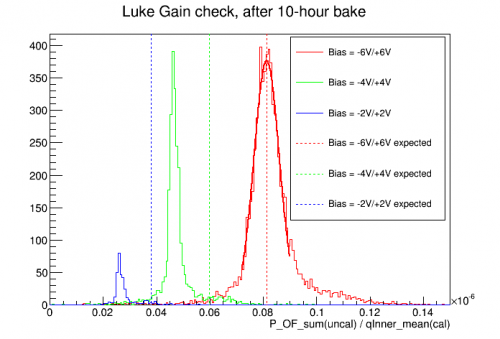
Using the -6/+6 V case as the standard, the peaks for the smaller biases appear close to where they are expected but a little lower, which could be an indicator of reduced charge collection efficiency at the lower biases. After the bake the pattern is the same but the phonon/charge ratio is higher than before. This clearly indicates something - it may indicate that charge collection efficiency has improved overall, although it is not clear from the position of the charge peak. The only peak available is the 60 keV line, and it is only clearly seen in surface-drift and shared events - it is not clear that we can see bulk-drift 60 keV events. The position of this peak does not change much with bias or after the bake. A surface-drift event is probably insensitive to trapping and will have high charge collection efficiency. So we are probably getting a good charge calibration. The same calibration was used for all three biases and before-and-after the bake.
Change in charge behavior during a series
Drifts in certain charge quantities have been seen during a series (and get reset after the flash). These drifts are seen strongly in the -2/+2 V data, less so in the -4/+4 V data, and not at all in the -6/+6 V data. The working hypothesis is that we are seeing loss of neutralization during a series in all three cases, but that the traps that are formed are shallow and are defeated at the higher biases; the bulk field is sufficiently large to prevent the carriers from trapping.
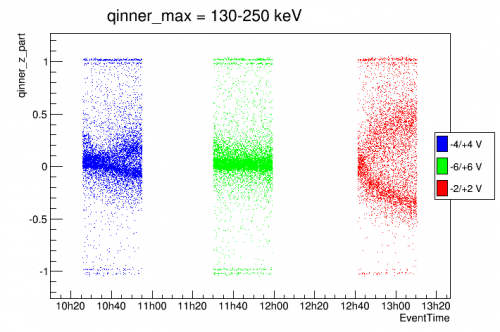
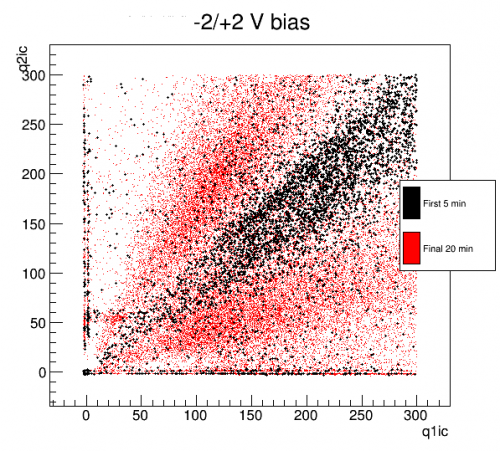
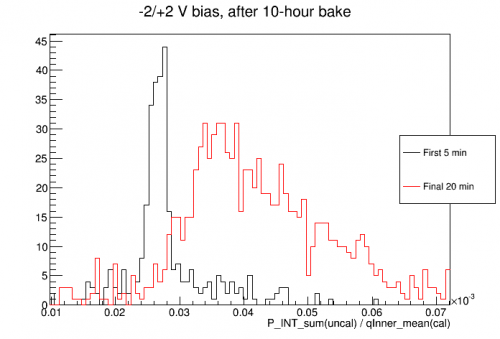
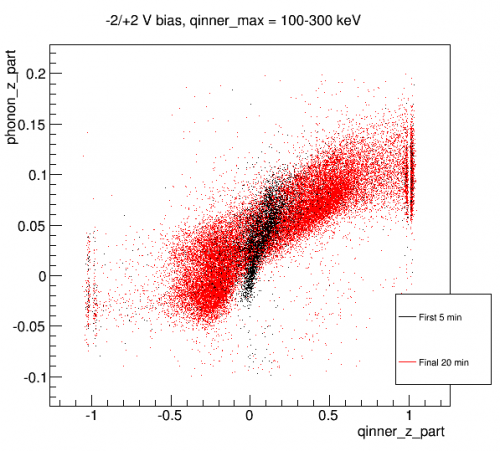
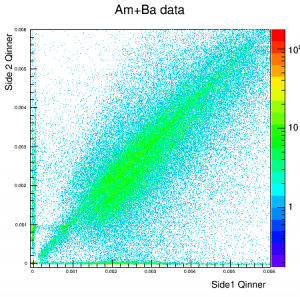
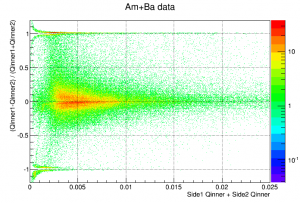
The most dramatic effect is a bifurcation in the charge side partition over time. No direct shift in any charge lines is seen, but as mentioned we seem not to have any bulk-drift lines available. The change in z-partition indicates that the relative amplitudes of the side1 and side2 charge channels are changing. Considering the shapes of the Ramo weighting potentials for charge channels in iZIPs, if charge collection of either or both of the carriers decreases an asymmetric response between the two charge channels is expected. And there should be different relative responses depending on the z-position of an event. But I have not been able to model the bifurcating behavior - I would expect a widening instead. In the late part of the series the data bifurcates into some events which are ~twice as large on Q1 and some that are ~twice as large on Q2. (It is difficult to tell whether one or both channels is changing, but the best guess from various observations of the data is that it's probably both.) The P/Q ratio increases after the bifurcation occurs (i.e. yield decreases) indicative of a loss of charge collection efficiency. The final plot above shows that the events that appear larger on Q1/2 also appear larger on the Side1/2 phonon channels, i.e. phonon-z correlates with charge-z. This is a useful clue which may help tease out the mechanism of what's happening.
An important point to this is that at our standard -4/+4 V bias, some indication of this time-dependent behavior during a series (loss of neutralization presumably) is seen. We should look at data from previous runs to see whether it's evident there too.
Effect of baking on phonon collection efficiency
Attempts to measure phonon collection efficiency after losing Side2qInner
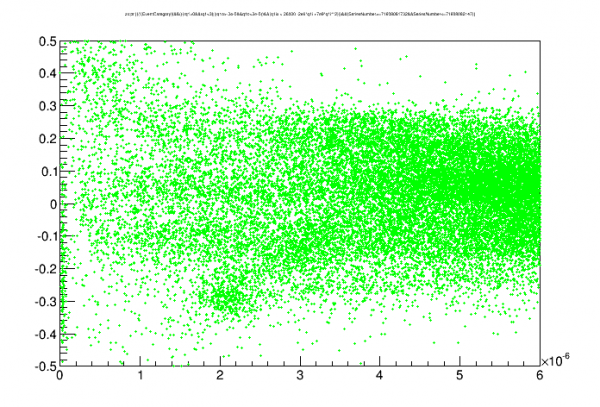 | 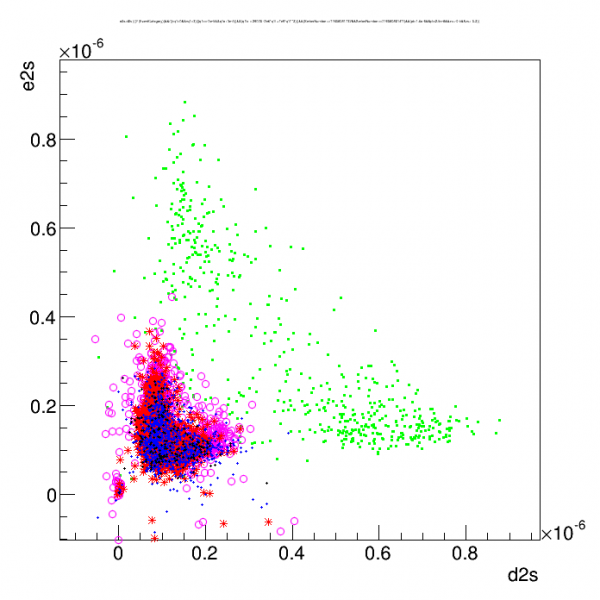 |
| phonon Z partition versus psum | amplitude of the two phonon channels that Am sources are aimed at green = first shield@0cm set, magenta&red = shield@180cm sets, blue&black = later shield@0cm sets |
|---|
We took 0cm data and measured 11.6% phonon collection efficiency. Then we took 180cm data (warm/cool with shield completely off) and got 5.7%. Then we took more 0cm data but only got 6.5%. Why did we not get back to the previous 0cm phonon collection efficiency??
Looking at individual phonon channel amplitudes reveals that a big difference between the first 0cm data and the later data is an apparent loss of the high amplitude events seen at 60 keV in Side 2 pE and Side 2 pD. This seems to be a loss of the surface-drift events from the two sources.
27-Jul	bake 15 hours
28-Jul	bake 12 hours
2-Aug	overnight pumpout ~ 4K
8-Aug	first 0cm data
	interesting note: flash and cooldown were set too short
9-Aug	warm/cool (630 nbar pumped out)
	take first 180cm data. (noise from leaky q-channel higher, second short probably appeared)
10-Aug	take second 180cm data with DIB2FETs off
	warm/cool (160 nbar pumped out)
11-Aug	take second 0cm data with DIB2FETs off
	bake 1 hour, take more 0cm data
	take more 0cm data with DIB2FETS off
	take more 0cm data with DIB2FETS on
12-Aug	bake 15 hours
13-15-Aug	take more 0cm data at various biases
15-Aug	pump out He buildup, then resume mu-metal study with daily pumpouts and nightly 12-hour bakes
Possible causes for the change in behavior:
- The first data was taken after long bakes. Note that these bakes occurred 11 days before the data was taken. Between the bakes and the data there were warming cycles, but the detector was never biased.
- This seems to rule out the notion that warming the detector to 4K deneutralizes it in a way that requires a long bake. Because the first data was taking after a warming with no bake between.
- Helium buildup doesn't seem to be the problem since there would have been more helium in the IVC for the first 0cm data than for later data.
- After the first 0cm data an additional short seemed to have appeared in the Side 2 Qinner circuit. Now there seems to be a short to chassis on both sides of the feedback resistor (the first is around 1 MΩ but the second is a very low resistance short). But this should not affect the detector behavior. FETs-on and FETs-off data looked similar. It is hard to imagine a scenario in which these shorts would interfere with detector behavior.
- On the other hand if a break in the Side 2 Qinner bias line occurred at the same time as the appearance of the second short, it would be a good explanation for the loss of surface-drift 60 keV events. And it would be difficult to check at base temperature whether this connection was broken.
- The good data was accidentally taken with short flashing between series. But it would be very surprising if this made a difference.
Update since 12 August: tests showed that the Qinner bias seems to still work, and that long baking seems to mostly restore the phonon collection efficiency. So we restarted mu-metal studies with daily pumpouts and nightly 12-hour bakes, taking three series each day after cooling with the shield at various positions.
 |
| Peaks for calculating phonon collection efficiency |
|---|
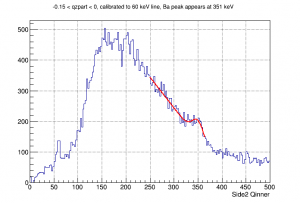
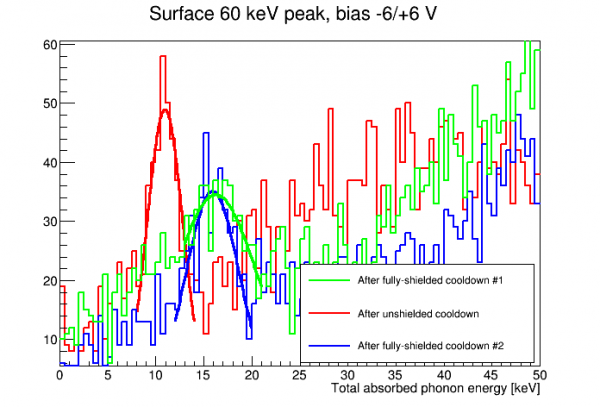
The method currently used to calculate phonon collection efficiency is based on isolating the surface-drift events using phonon-z-partition then finding the 60 keV peak. We are currently using a -6/+6 V bias so for surface-drift events the Luke gain should be 3.0, so these events should produce a total of 180 keV in phonon energy. The total collected phonon energy is calculated from a sum of phonon integral rq's calibrated to absorbed energy in keV.
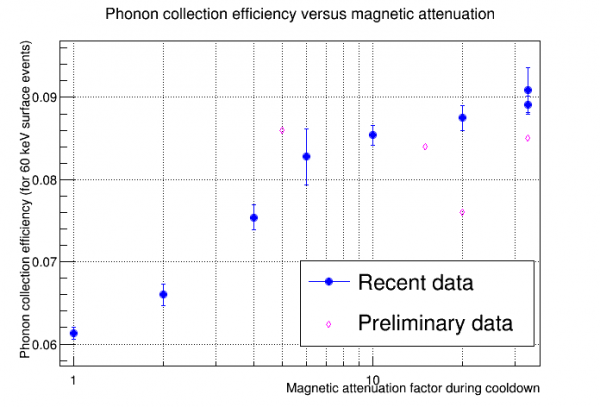
On August 16-18 we took data after a 0cm (fully-shielded) cooldown, then after a 180cm (unshielded) cooldown, then again after a 0cm cooldown. We pumped out He during the warmup/cooldown procedure and before each measurement we baked the detector for 12 hours. This time we were able to repeat the behavior seen in Run 56: the phonon collection efficiency went down in the unshielded case then returned to the same value after a second shielded run.
| Phonon collection efficiency (for 60keV surface-drift events) | |
|---|---|
| first shielded cooldown | 9.09 ± 0.27 % |
| first unshielded cooldown | 6.13 ± 0.07 % |
| second shielded cooldown | 8.91 ± 0.11 % |
The phonon collection efficiency in the unshielded cooldown case is 33% smaller than in the shielded cooldown case. The two shielded cooldown cases are identical within error.