Table of Contents
Run 57 Summary
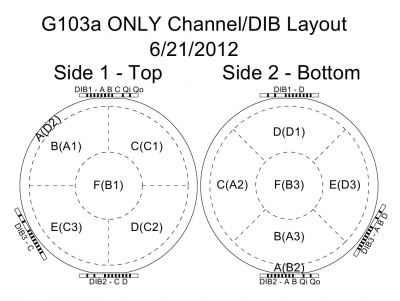
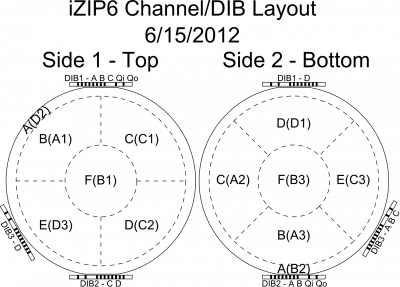
Correction to phonon channel map...
channelmapcorrection.pdf
 |  |
Elevated base temperature
- Tower base temperature with DCRCs on this run is about 52 mK (compare Run 56, about 31 mK).
- Cold plate temperature high this run: 310 mK with DCRC's on. (compare Run 56, 160 mK)
- Cold plate was also hot in Run 52. In that run we determined there was a touch between the bottom of the cold plate can and the 4K stripline heatsink
- Is there a cold plate touch this run?
- stripline heatsink (but it was moved after Run 52)
- 600mK rod, but usually this is not a problem
- modifications on tower - did we somehow create a touch between tower stages?
Critical temperatures and Normal resistances
With three DCRCs running, the base temperature is such that all but one phonon channel are above their s/c transition temperatures. One seems to be in transition at the base temperature. The temperature can be reduced by turning off some or all DCRCs, about 2 mK per DCRC. The temperature also falls significantly during one-shot tests. Combining these procedures, more critical temperatures could be measured, though several seem to be below the minimum achievable temperature.
Normal resistances were measured using a “mini-IbIs” technique, by setting two different QET biases both high enough to drive the TES normal and comparing the phonon channel baselines. Below is a summary of Rn and Tc measurements taken on 2016 April 29:
| Rn [Ω] | Tc middle [mK] | Tc width [mK] | |
|---|---|---|---|
| DIB1 pA | >200 | n/a | |
| DIB1 pB | 0.319 | <43.9 | |
| DIB1 pC | 0.527 | <43.9 | |
| DIB1 pD | 0.306 | <43.9 | |
| DIB2 pA | 0.357 | n/a | |
| DIB2 pB | 0.592 | 49.3 | 0.6 |
| DIB2 pC | 0.415 | 50.8 | 2 |
| DIB2 pD | 0.548 | 53.4 | 1.2 |
| DIB3 pA | 0.33 | <43.7 | |
| DIB3 pB | >800 | n/a | |
| DIB3 pC | 0.257 | 44.55 | 1.3 |
| DIB3 pD | 0.416 | <43.7 |
- Two channels, DIB1pA and DIB3pB, showed almost no response to changes in QET bias so they must be open or have very high resistances.
- Channels indicated “n/a” are cases where no test signal could be seen on the channel, so no Tc was measurable. This is the case for the two open channels and for some reason one additional channel, DIB2 pA
- Several channels appeared to be normally resistive down to the minimum temperature reached, so the Tc's are shown as upper limits.
HV tests
Corrected Vcrystal calculation
The HV board is set up so that a 400 MΩ bias resistor (Rb) and a 1 MΩ test resistor (Rt) are in series with the HV input. We measure voltage (Vt) across Rt to calculate the leakage current, and from that calculate the voltage at the crystal (Vc) by considering the voltage drop across Rb. The formula is expected to be
Vc = HV - [Rb/Rt]*Vt = HV - 400*Vt
(This assumes Rb»Rt; deviation from this approximation is only 0.25%.)
Empirical evidence in Run 54 however suggested the formula should be Vc = HV - 430*Vt. One thing we neglected was the finite input resistance (Ri) of the multimeter. The Fluke 87V multimeter has a 10 MΩ input resistance in voltage mode. Taking Ri into account we get
Vc = HV - [(Ri+Rt)/Ri]*[Rb/Rt]*Vt = HV - 440*Vt
This is much closer to the empirical formula used in Run 54.
HV leakage problem
Initially this detector with the now-corrected phonon mapping showed that it was able to hold a high voltage and still show good phonon pulses. However starting on May 4 it transitioned into a high leakage mode which prevented us from being able to apply a high bias.
Temporary low-leakage state
Initial HV tests were promising. On May 2 using the 0-40 V supply we were able to apply up to 30 V of bias with leakage current around 1 nA (less than a 1 V drop across the bias resistor), with phonon pulses present up to 20 V. On May 3 with the 0-1 kV supply we saw similar low leakage with pulses at a bias as high as 40 V, though later the maximum voltage at which pulses were present seemed to be about 30 V. On both days it was found that leakage current was higher after initially increasing the voltage, but it would relax to a low value after a couple of minutes.
At around 35-40 V, temperature and leakage spikes appeared periodically. The leakage current would rise to as much as 50 nA then fall again, accompanied (with a small time delay) by a rise and fall in base temperature of as much as 20 mK. The temperature spike pattern was rather similar to spikes seen early in the and attributed to the cryogenic problems. These cryogenic-related spikes occurred frequently when the still heater was being used, less so when it was off, and disappeared completely after a few days at base.
What we've learned
From our experience with this detector in its low-leakage state and our experience applying HV to G106a with incorrect phonon mapping we can make two generalizations:
- We can put significant bias (at least 30 V) across the faces of a detector without any appreciable current going through the detector (not enough to cause the phonon baselines to rise detectably).
- If we apply a voltage (more than a few V) between two channels on the same side of a detector it will draw enough current to shift the phonon baselines, and drive the TESs normal at higher voltages, and cause a rise in base temperature at still higher voltages.
High-leakage state
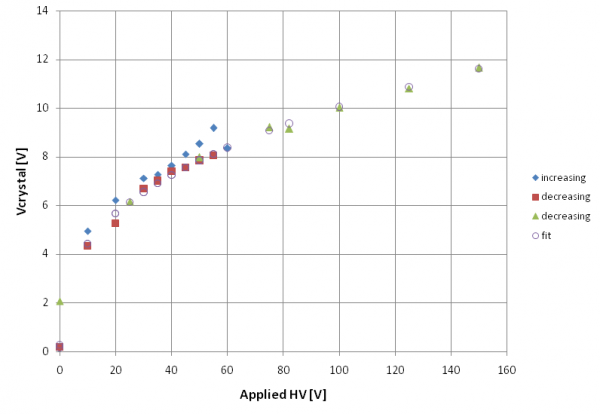
On May 4 while increasing HV during another series of measurements, the system suddenly transitioned into a high-leakage state (when the HV had reached 35 V). The leakage current rose with HV, with about 55 nA seen at 30 V. At such high leakages, most of the applied HV drops across the bias resistor, making it impossible to apply a bias to the crystal of more than about 15 V:
This state proved persistent. Repeated attempts to restart the DCRCs, disconnect the cables from the Ebox etc failed to improve the situation.
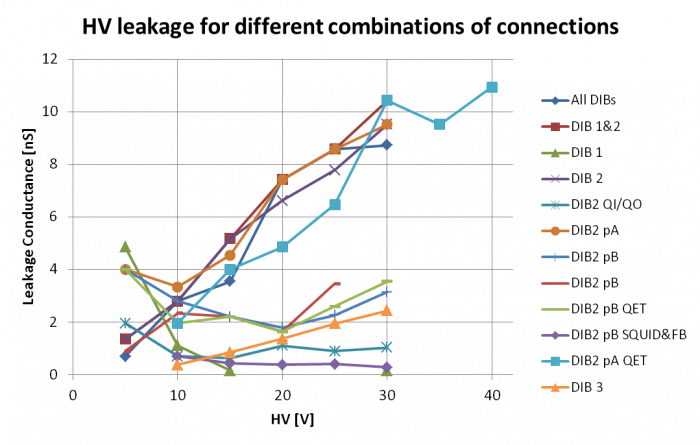
We investigated the leakage by disconnecting various combinations of wires. Initially the various test results were confusing, but after thinking about them it was realized that one model could explain all the results: there is a path to ground (several nS, depending on the bias) from one of the DIB2 pA QET lines, likely in either the stripline, SQUET, tower, or connections between them. DIB2 pA is one of the central channels on Side 2, the HV-biased side. Below are the observations supporting this hypothesis:
- in normal setup, leakage of about 10 nS @ HV = 30 V. Power dissipated as high as several μW but no change in base temperature.
Explanation: the path from DIB2pA QET to ground is drawing current somewhere warmer than the MC stage. - Connecting only DIB2 pA QET lines produces as much leakage as the standard setup.
- Connecting only DIB2 pB QET lines produces not quite as high leakage (around 3 nS @ HV = 30 V), and causes rise in base temperature. Note that DIB2 pB is on the HV side too.
Explanation: with HV applied to only one channel on Side 2, there is a path from that channel across to the leaky DIB 2 pA, then to ground. The leakage is smaller due to the additional inter-channel resistance. But in this case some of the power is dissipated in the crystal, and thus heats the base.
Further checks: The dissipated leakage power (as calculated from the HV and leakage current) is approximately equal to the dissipated power inferred from the rise in base temperature. - Connecting only DIB2 pB SQUID and Feedback lines produces very low leakage
Explanation: there is no path from these lines to the leaky channel. - Connecting only DIB3 produces a leakage similar to the DIB2 pB QET case.
Explanation: DIB3 has three phonon channels on the HV side, two of which are adjacent to the leaky channel, like DIB2 pB. - Connecting only DIB2 qI&qO lines produces lower leakage (around 1 nS @ HV = 30 V), with no rise in base temperature noticed. These are the HV side charge channels.
Explanation: Similar to the DIB2 pB QET case but apparently the resistance between the charge channels and DIB2pA is larger. - Connecting only DIB1 (all lines) produces almost no leakage.
Explanation: There is one DIB1 phonon channel on Side 2 and it is next to DIB2pA. Apparently this inter-channel resistance is very high. This is somewhat anomalous but if only some same-side inter-channel resistances are low, it still supports all the observations. - An attempt to avoid the leakage and take phonon data failed. This involved connecting DIB1 and DIB2 without its two HV-side phonon channels, so that Side 2 was biased on the charge channels and one phonon channel (the other Side 2 channels were floating). Leakage was manageable but the phonon baselines rose with rising HV, and phonon pulses disappeared entirely at 9 V. Similar results were seen if DIB1 was disconnected.
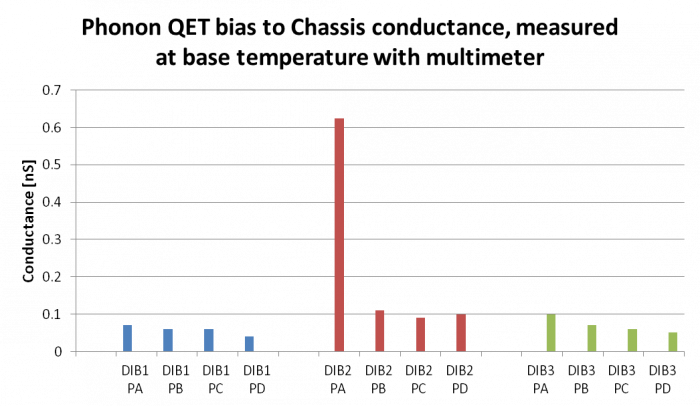
Explanation: the leakage from the charge channels across to the leaky channel was enough to kill the TESs. - Measuring resistances from the phonon channels to chassis with a multimeter results in a much higher value for DIB2pA (0.6 nS) than the others (around 0.1 nS or smaller).
- Measuring interchannel resistances with a multimeter it was found that most were around 0.1-0.2 nS, but some were much higher: DIB2pA-DIB2pB (40 nS), DIB2pA-DIB3pA (10 nS), and DIB3pB-DIB3pC (24 nS). The resistance between the DIB1 channel on Side 2 (DIB1pD) and DIB2pA is high (0.05 nS). This fits the pattern seen concerning which Side 2 phonon channels produce the most leakage through the leaky channel.
 |  |