2022/04/22 (Friday)
- Lab in-personnel: Matt
| Status | Run 76 in progress |
|---|---|
| Setup | Cables 2/3/1 → diverter/nothing/nothing → Side2-readout HV CONN 1/3/2 → HV 1(L)/2(R) → DCRC50(3)/DCRC55(1), DCRC33(2)→HV control, NaI trigger signal → DCRC52(6) |
| 1125 | MC/Coldplate = 28.6/140 mK, Still = 1.10 K / 0.110 mbar / 0 mW, G1/G2= 120/113 mbar, 1K Pot = 18° / 1.62 K / 18±1 mbar, MB = 41.7% |
| Note: Mike has our recovery valved out temporarily, so some things are elevated - 1K Pot and circulation are a little higher than earlier this morning. | |
| 1125 | MB = 2.3 PSI. If it goes too high we should release some pressure. |
| 1125 | Goldman = 73.2 mK @ 632 uV excitation |
| 1130 | Fill LN2 cold trap bath |
| In recent Side2 100V and 22V data I couldn't resolve a 14keV line. But in 0V 2-sided data (the most recent one with the current source position) I can resolve the low energy lines looking at only Side2 channels. So let's try a 0V series now, see if it looks like the 2sided 0V data. | |
| 1144 | Start 0 V data series 40 min long, with 1000 initial randoms, 0 Hz in-run randoms, trigger on DCRC3pD threshold 10. Start series with the Start Button. |
| 1145 | MB = 2.7 PSI. |
| 1225 | MC = 28.7 mK, a little higher, maybe because of the high pressure in the MB |
| 1225 | MB = 3.4 PSI. Asking Mike if we can open the valves for a minute to let out some pressure… |
| 1230 | Open recovery valves for ~20 seconds, MB → 2.0 PSI. MC temperature dips briefly, then comes back up. A minute later MB → 2.6 PSI again, guess we didn't let that much out. |
| Let's try negative HV | |
| 1240 | Swap HV leads for negative bias |
| 1244 | Dial HV up to -113.4 V using RootSequencer for prebias. Set it to rise about 5 V/s with 0.25 second steps. |
| 1249 | After 5 minutes dial HV down to -98.4 V |
| 1250 | Start -98.4 V data series after 5 min 15% prebias, 61 min long, with 1000 initial randoms, 5 Hz in-run randoms, trigger on DCRC3pD threshold 10. Start series with the Start Button. |
| 1250 | MB = 4.0 PSI. |
| 1255 | Let some pressure out of MB by popping a stopper off the port. MB → 1.9 PSI |
| 1300 | MB = 2.6 PSI. |
| 1305 | Mike finishes work on recovery system, MB now open to reco again. Pressures and temps relaxing back to normal. |
| 1330 | MB = 0.5 PSI. |
| 1355 | Dial HV down to 0V after data series ends. |
| 1355 | Put Na-22 source near fridge. It's on one of the metal platforms which is on the shield platform on the North side. Build a lead castle around the source. Source is roughly level with SiHV and around 10cm from the SiHV detector. The purpose is to do another threshold scan in the NaI array - we should see the Na line(s). |
| 1410 | Count pulses to measure rate in S104 with Na-22 source in current position. 86 pulses in 100 3.2768-ms traces → 262±28 Hz. Average 0.86 pulses/trace → pileup fraction = 58%, pretty high. Assuming 1/r-squared (with mu-metal shield OD = 53.5 cm), source at 30/40 cm from shield would be 30%/23% pileup. |
| 1515 | Tape Na-22 source to NaI detector 11. The NaI array is set to trigger on 10,11,&12 - these are the NaI detectors at the approximate level of the SiHV detector. Trigger scan at previous source position was not very high above background. |
| 1537 | Begin LHe transfer @ MB = 35.4% |
| 1630 | End LHe transfer @ MB = 95.6% |
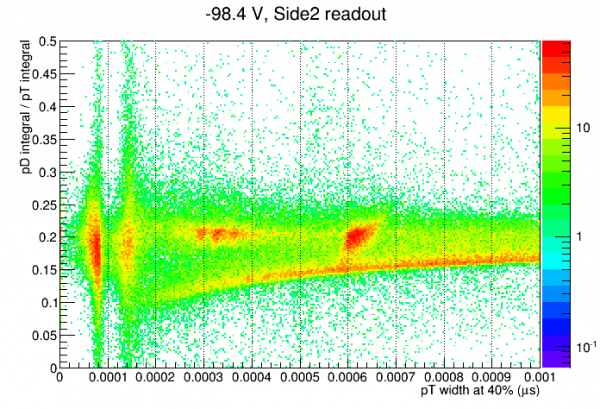
0V-data analysis note: can resolve the 14keV line, in PTOFamps (not in PTINTall though).
-100V-data analysis note: I can resolve the 14keV line! Using pulse-width. Interesting: this suggests electron-drift events give better resolution than hole-drift events, when reading out on the side opposite the source. Noise width = 5.5 eVee