2020/08/31 (Monday)
- Lab in-person: Matt
- Virtual partner: Zach (via Slack pinging)
| Setup | Run 73. DIB 1/3/4 → Stripline 43/48/41 → pi-filters 1/2/3 → Cable 3/1/2 → nothing/nothing/accessory_interposer → HV_Conn 1/3/2 → HV 1/2 → DCRCX(4)/DCRC55(1)-master; DCRC33(2) → HV control. DCRCs on overnight. Lead/poly shield erected (4 lead walls, 2 poly walls). |
|---|
| 80%-20% boiloff time [hours] | |
|---|---|
| early Run 73 | 40.3 |
| after partial warmup | 34.1 |
| after pumping CVJ 2 days | 37.1 |
| The table above implies that we have only partially restored the boiloff rate after additonal pumpout of the cryostat vacuum jacket. Probably should try to pump it out more. | |
| 0900 | Tower = 48.9 mK |
| 0940 | Matt Fritts body temperature 96.7 F |
| 1030 | Check channels with SQUID Tuning GUI. DCRC1pD threshold was recently set to 12 - looks ok at 8, so setting it back there. But this is at 0V so maybe it will need to be raised at bias. |
| 1030 | Accidentally wrote a sequence for -200V and started it. Meant to do one at +200V. |
| 1045 | Write a sequence for +200V drifted 33.1 mV/s with 15% 2min prebias HVdrift_pos200V_pre15_2min_33p1mVps_multiloop10_60min.msl |
| Probably need to flash detector since I raised the HV to 20V before aborting the sequence. | |
| 1100 | Flash LEDs for 15 seconds |
| 1135 | Matt arrives in lab |
| 1140 | Fill LN2 cold trap bath |
| 1140 | Turbo on IVC = 4 nbar. With Turbo valved out for 1 minute, IVC = 54 nbar |
| 1143 | MB = 64.5% |
| 1150 | Isolate IVC and move Turbo Pump Station hose over to Cryostat Vacuum Jacket port |
| 1155 | Cryostat Vacuum Jacket = 1.0 ubar |
| 1155 | Start Turbo Pumping the Cryostat Vacuum Jacket |
| Tower was still cooling after the flash, down to 49.7 mK, then rose a bit to 50.2 mK after ending the LN2 fill. | |
| 1200 | Tower/MC/Coldplate = 50.2/31.2/189 mK, Still = 1.41 K / 0.095 mbar / 0 mW, G1/G2= 249/240 mbar, 1K Pot = 1.70 K / 50±2 mbar. |
| 1215 | Turbo on Cryostat Vacuum Jacket = 14 nbar. With Turbo valved out for 1 min, Cryostat Vacuum Jacket = 0.19 ubar. Resume pumping. |
| 1223 | Start a 60 min series at HV = +200V, drifting 0.0331 V/s, prebias 15% for 2min, CDMS detector: Driver Gains = 1x, DCRC4/1 QET biases = (0,320,370,0)/(0,360,420,410)uA, Front-End Gains = (3/3/3)/(5/5/5) 1000 BOR & 5 Hz in-run randoms, trigger on DCRC1pD threshold = 8 Use sequence HVdrift_pos200V_pre15_2min_33p1mVps_multiloop10_60min.msl |
| 1223 | Tower = 50.6 mK |
| 1223 | Vtest = 10.6 mV shortly after drift begins. Drift appears to start at +202.8 V. 2.1% HV loss. |
| 1321 | HV = 303.1 V. After this point, HV does not read correctly - this must be the maximum that the HV meter can measure. HV rate of change implies Lag Ratio = 1.1ish. Vtest = 11.0 mV, 1.5% HV loss. |
| 1335 | Tower = 50.5 mK |
| 1225 | Take a look with BatViewer, looks like there are a lot of low-amplitude junk triggers, but it is not triggering constantly. Trigger threshold 8 is probably OK. |
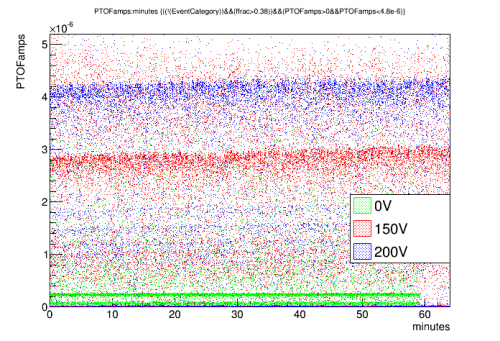 |
| Gain is rising slightly with time, suggesting 31.2 mV/s is optimal |
| 1230 | Matt leaves lab |
|---|---|
| 1505 | Matt Fritts body temperature 97.2 F |
| 1530 | Write sequence for +250V, 32.5 mV/s with prebias HVdrift_pos250V_pre15_2min_32p5mVps_multiloop10_60min.msl |
| 1554 | Start a 60 min series at HV = +250V, drifting 0.0325 V/s, prebias 15% for 2min, CDMS detector: Driver Gains = 1x, DCRC4/1 QET biases = (0,320,370,0)/(0,360,420,410)uA, Front-End Gains = (3/3/3)/(5/5/5) 1000 BOR & 5 Hz in-run randoms, trigger on DCRC1pD threshold = 8 Use sequence HVdrift_pos250V_pre15_2min_32p5mVps_multiloop10_60min.msl |
| 1554 | Tower = 50.2 mK |
| 1554 | Vtest = 7.5 mV shortly after drift begins. Drift appears to start at +252.4 V. 1.2% HV loss (low!). |
| 1626 | HV = 303.1 V, the maximum that the HP meter can measure. Vtest = 8.0 mV, 1.1% HV loss. |
| 1706 | Vtest = 9.3 mV then falls, indicating drift has ended: Lag Ratio = 72/60 = 1.2, significantly higher than the usual 1.1. HV at end of drift should be 371.4 V according to sequence, indicating 1.0% HV loss. |
| later look at data shows Lag Ratio = 1.19 | |
| 1706 | Tower = 50.1 mK |
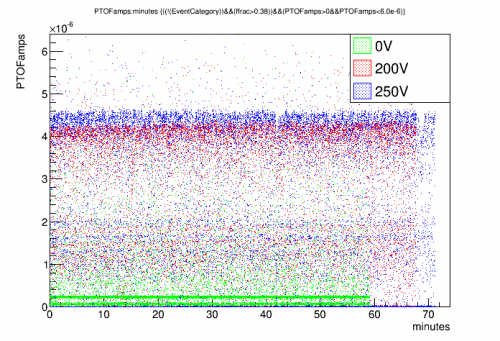 |
| Overall the drift rate seems correct. But the lag ratio is high for this series, 1.19. If we correct for the usual 1.1, the nominal drift rate should be reduced to 30.0 mV/s. |
| 2140 | Write sequence for +300V at 31.6 mV/s with prebias HVdrift_pos300V_pre15_2min_31p6mVps_multiloop10_60min.msl |
|---|---|
| 2206 | Start a 60 min series at HV = +300V, drifting 0.0316 V/s, prebias 15% for 2min, CDMS detector: Driver Gains = 1x, DCRC4/1 QET biases = (0,320,370,0)/(0,360,420,410)uA, Front-End Gains = (3/3/3)/(5/5/5) 1000 BOR & 5 Hz in-run randoms, trigger on DCRC1pD threshold = 8 Use sequence HVdrift_pos300V_pre15_2min_31p6mVps_multiloop10_60min.msl |
| 2207 | Tower = 49.8 mK |
| 2207 | Vtest = 7.8 mV shortly after drift begins. Drift appears to start at +302.1 V. 1.0% HV loss. |
| 2317 | Vtest = 9.8 mV then falls, indicating drift has ended: Lag Ratio ~ 1.2, significantly higher than the usual 1.1. HV at end of drift should be 417.5 V according to sequence, indicating 0.9% HV loss. |
| 2317 | Tower = 49.8 mK |
| later look at data shows Lag Ratio = 1.18 |
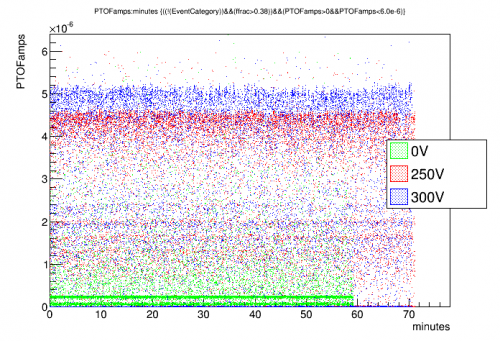 |
| Surprisingly the drift looks just right, even though the lag is higher than normal. |
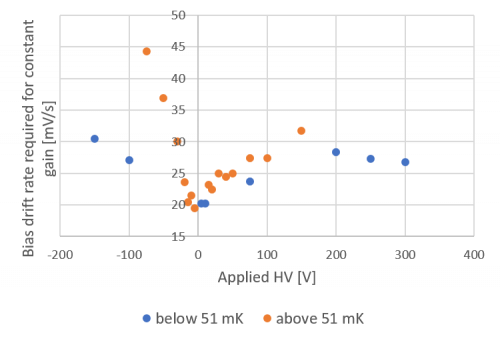 |
| Note these are true drift rates, corrected for lag |