2020/07/31 (Friday)
- Lab in-person: Matt
- Virtual partner: Zach
| Setup | Run 73. DIB 1/3/4 → Stripline 43/48/41 → pi-filters 1/2/3 → Cable 3/1/2 → nothing/nothing/accessory_interposer → HV_Conn 1/3/2 → HV 1/2 → DCRCX(4)/DCRC55(1)-master; DCRC33(2) → HV control. DCRCs on overnight. Lead/poly shield erected (4 lead walls, 2 poly walls). |
|---|---|
| 0735 | MB = 36.3% |
| 0800 | Matt Fritts body temperature 97.4 F |
| 0800 | Tower = 50.9 mK |
| 0800 | Edit 5-V drifted fast-loop-version sequence so that instead of stepping Charge/Bias by -0.001 every 2 seconds 1800 times, it goes -0.002 every 2 seconds 900 times. HVdrift_5V_21p4mVps_fastloop_nopre_60min.msl |
| 0806 | Start a 60 min series at HV = 5V, drifting 0.0214 V/s, no prebias, CDMS detector: Driver Gains = 1x, DCRC4/1 QET biases = (0,320,390,0)/(0,360,420,440) uA, Front-End Gains = (3/3/3)/(5/5/5) 1000 BOR randoms, trigger on DCRC1pD threshold = 8 Use sequence HVdrift_5V_21p4mVps_fastloop_nopre_60min.msl (now adjusted to drift twice as fast to correct for the sequencer lag) |
| 0809 | Vtest ~ 0.3 mV near beginning of drift. |
| 0810 | Tower = 51.0 mK |
| 0824 | Vtest ~ 1.0 mV |
| 0910 | Vtest ~ 3.0 mV, just before end of drift |
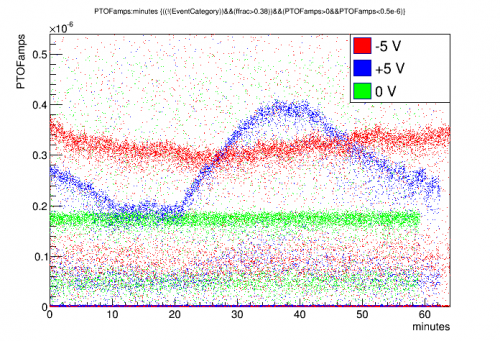 |
| This morning's 5V data does not keep the Luke gain constant. Maybe because of nonlinearity in the calibration? |
- Nonlinearity in the calibration explains part of this. The calibration becomes linear after around 15-20 V; below that it's different.
- This could definitely explain why the Luke gain falls for the first ~10 minutes, then becomes flat when we get to the linear region
- But the rise starting at 20 minutes, then fall later, can't be explained by this - the calibration should be linear for that period
- There's a hint in the Vtest record of the same pattern, which suggests that the HV was not rising at a constant rate…
- which suggests that the MIDAS lag may not be constant… could be that it varies with network traffic or something.
- We may need a “hybrid” sequence that uses the original non-loop lines up to around 20V, then transitions into the loop
- or maybe the nonloop version is actually better…
- The lags seen suggest that there's about a 1-second lag per step in the nonloop version, 2-seconds per step in the loop version
- maybe each line takes around 0.5 seconds to read. In nonloop, that's the setting and the wait - in loop there are also the Loop and Endloop lines
| 1140 | Build a new sequence for 5-Volt data, with no pre-biasing. Standard nonloop. We will decrease the time between steps from defaule 10 seconds down to 5 seconds. We'll use a higher drift rate, 23.5 mV/s, to try to compensate for the expected increase in lag. python HVscan.py -iDCRC 2 -HVs 5 -HVcalFile HV_calibrations/HV_DCRC2_control_cals_500V_200721.txt -HVdriftRate 0.0235 -HVdriftUpdatePeriod 5 -tSeries 60 -DCRCs2Flash 1 » ../../sequencer/HVdrift_5V_23p5mVps_5s-steps_nopre_60min.msl |
|---|---|
| 1150 | Start a 60 min series at HV = 5V, drifting 0.0235 V/s, no prebias, CDMS detector: Driver Gains = 1x, DCRC4/1 QET biases = (0,320,390,0)/(0,360,420,440) uA, Front-End Gains = (3/3/3)/(5/5/5) 1000 BOR randoms, trigger on DCRC1pD threshold = 8 Use sequence HVdrift_5V_23p5mVps_5s-steps_nopre_60min.msl |
| I'm already concerned that this will be more laggy than usual, watching the Sequencer as it started. Could be the extra length of the sequence script makes it laggier. | |
| 1150 | Vtest ~ 0.2 mV shortly after start of drift |
| 1200 | Tower = 51.1 mK |
| 1202 | Checking the current DCRC Charge/Bias shows that it's at the 7.9-minute point in the series, but 12 minutes have elapsed. That suggests a lag of 25% greater than what I would have predicted. |
| 1211 | Vtest ~ 1.0 mV |
| 1234 | Vtest ~ 1.7 mV |
| 1300 | Matt enters lab |
| 1305 | Tower/MC/Coldplate = 50.8/30.9/192 mK, Still = 1.50 K / 0.18 mbar / 5 mW, G1/G2= 390/357 mbar, 1K Pot = 1.64 K / 26±2 mbar. |
| 1307 | Vtest ~ 2.7 mV |
| 1317 | Vtest ~ 3.0 mV, drift ends. Took 87 minutes instead of 60. |
| 1329 | Begin LHe transfer @ MB = 25.7% |
| 1406 | End LHe transfer @ MB = 92.7% |
| 1515 | Write a new sequence for 5V drift. This is a loop version with multiple loops to separately drift the voltage between different calibration points, using the appropriate step value in each region of the calibration. Step time is 5 seconds, hopefully this will produce smoother voltage. Attempted to adjust the drift rate to account for expected lag: it is nominally 27.2 mV/s. HVdrift_5V_27p2mVps_multiloop_nopre_60min.msl |
| 1535 | Attach HV output to HP meter and start reading this out on Omni_Logger.vi on LabVIEW. We had a problem with this before because the meter maxxed out at a few hundred V, but we aren't going that high currently, sequence scripts only go to a little over 100V. That is within the range of the meter. Checked the meter while changing the /Charge/Bias setting, with the HV box disconnected - meter goes above 200V. |
| 1545 | Fill LN2 cold trap bath |
| 1550 | Matt leaves lab |
| 1703 | Start a 60 min series at HV = 5V, drifting 0.0272 V/s, no prebias, CDMS detector: Driver Gains = 1x, DCRC4/1 QET biases = (0,320,390,0)/(0,360,420,440) uA, Front-End Gains = (3/3/3)/(5/5/5) 1000 BOR randoms, trigger on DCRC1pD threshold = 8 Use sequence HVdrift_5V_27p2mVps_multiloop_nopre_60min.msl |
| 1704 | Vtest ~ 0.3 mV shortly after start of drift |
| 1705 | Tower = 52.0 mK |
| 1717 | Vtest ~ 0.8 mV |
| 1718 | HV seems to be rising at a constant rate as seen on the HP meter. Currently HV = 22.3 V. Nominally it should have hit that value after 13.7 minutes - in true time it has taken about 15 minutes. So lag ratio is around 1.09. Smaller than expected. |
| 1735 | Vtest ~ 1.4 mV. HV = 41.4 V. Vtest does not look very smooth. |
| About 29 minutes after the drift began, it looks like the rate of increase in HV increased a bit. This should be well into the 5th loop, the longest loop, where the calibration is the most linear. So, either the calibration is not as linear as we think it is in that regime, or perhaps the DAQ lag is different. (If we were also monitoring the ODB setting versus time we'd know which is the case, but I haven't been doing that.) | |
| At about the same time that the HV rate increased, Vtest started to exhibit a more regular pattern, with a period around 4 or 5 minutes (although the period gets shorter over time). | |
| 1803 | Vtest ~ 2.5 mV. HV = 80.0 V. |
| 1819 | Vtest ~ 3.1 mV. HV = 101.1 V. Drift ends. |
| Total drift time was about 76 minutes. Lag ratio = 1.27 overall. That suggests about 1.33 seconds/step. (Had guessed around 2 seconds/step, which seemed to be the case in other loop versions.) | |
| 1855 | HV hasn't quite settled to its pre-bias value, currently 36 mV, was 15 mV before biasing. It's still slowly falling. |
| 1730 | Matt Fritts body temperature 97.5 F |
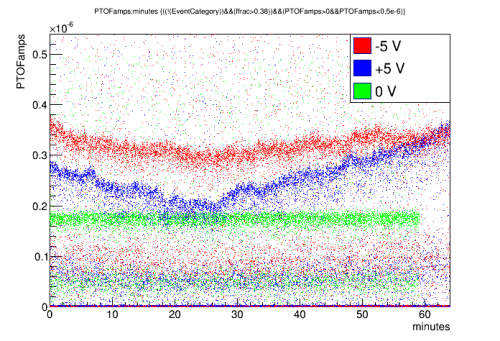 |
| From this evening's +5V drifted data. Note that rate of change of Luke gain changes after 30 minutes, consistent with the observed increase in HV drift rate |
- If we want to flatten the first 30 minute part, estimates suggest changing the nominal drift rate to 32.2 mV/s.
- Analyzing the LabVIEW Omni_Logger vi log, it looks like the real HV drift rate was 19.7 mV/s in the early part, 22.2 mV/s in the late part (13% faster)
| Let's repeat this sequence to see if the pattern repeats. If not, then it probably has something to do with variations in DAQ speed. If so then possibly the HV calibration needs to be adjusted. | |
| 2217 | Start a 60 min series at HV = 5V, drifting 0.0272 V/s, no prebias, CDMS detector: Driver Gains = 1x, DCRC4/1 QET biases = (0,320,390,0)/(0,360,420,440) uA, Front-End Gains = (3/3/3)/(5/5/5) 1000 BOR randoms, trigger on DCRC1pD threshold = 8 Use sequence HVdrift_5V_27p2mVps_multiloop_nopre_60min.msl |
| 2218 | Vtest ~ 0.3 mV shortly after start of drift |
| 2220 | Tower = 51.2 mK |
| The regular pattern in Vtest starts immediately this time, rather than 29 minutes after the drift begins | |
| 2231 | Vtest ~ 0.9 mV, a little higher than last time |
| 2232 | HV = 24.2 V. Seems to be rising faster than last time. |
| 2249 | Vtest ~ 1.8 mV. HV = 46.9 V, both significantly higher than last time… HV seems to be rising 13% faster. Which means it is rising at the faster of the two rates from last time. |
| 2308 | 51 minutes into the drift - up to now the rate of HV drift looks very constant. |
| 2317 | Vtest ~ 2.9 mV. HV = 84.2 V. |
| 2329 | Vtest ~ 3.4 mV. HV = 100.9 V. Drift ends. |
| Total drift time was about 72 minutes. Lag ratio = 1.20 overall. That suggests about 1.00 seconds/step. |
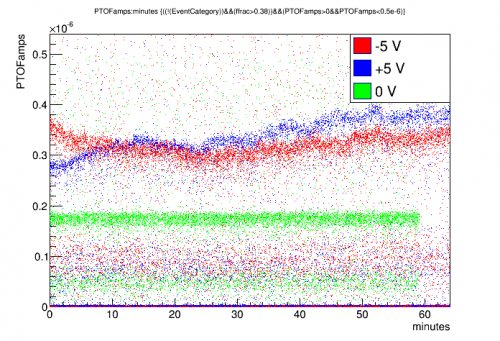 |
| This most recent +5V drifted data has relatively straight Luke gain vs. time. Looks like drift is a little too high, should try reducing 27.2→23.5 mV/s (nominal). The fact that these last two are so different suggests, sadly, that there are random differences in DAQ speed. DAQ speed appeared to be good after about 17:30 - maybe network activity fell. |