2019/01/02 (Wednesday)
| 1230 | Remove PuBe source from PAN 443 and place in SW corner of PAN 43, behind the IGH. |
|---|---|
| 1311 | Take a few NaI spectra and compare to one taken last week w/o source. Unable to see 4.4 MeV PuBe peak clearly as we did in the tests here. Move it to the South wall of the lab, just behind the NaIs. |
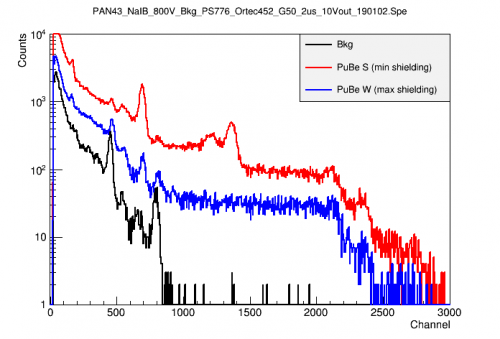
| 1400 | Okay, now it shows up a little better. Below is a comparison of the PuBe spectra in 3 positions. These spectra were each taken with 100s livetime, with PMT bias=800V, using the PS776 Preamp and Ortec 450 amplifier (G=50, 2us, 10V out) and digitized with the Ortec EasyMCA. |
 |
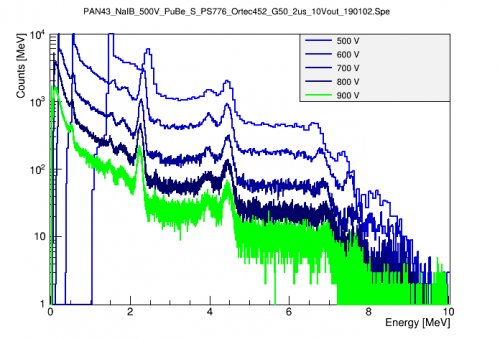
| 1430 | Here are some bias-scan spectra also using the PS776 preamplifier with the PuBe source at the South wall of the lab.. With this setup and range of biases, there doesn't appear to be much distortion of the spectrum when changing biases. This probably means that the PMT bias is low enough that it doesn't saturate the pre-amp or amp. All spectra are calibrated to 0 and 4.4 MeV. A slight shift in peaks to the center is observed at the lowest bias, this may be simply due to a constant offset present in all spectra. |
|---|
 |
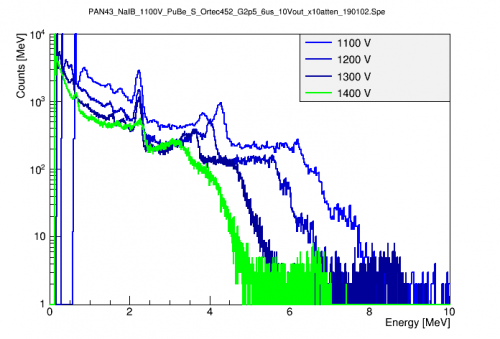
| 1530 | Change back to the old way of operating with no preamp, a higher PMT bias, and a x10 attenuator on the amp output. The spectra below are from a bias scan under those conditions with the PuBe source at the South wall of the lab. These spectra are calibrated to 0, 2.2 MeV. There is clearly some sort of saturation of the signal occurring under these conditions. It's not clear whether that is due to the high PMT bias or the lack of a pre-amp. we should probably try this again at lower bias to figure that out. |
|---|
 |
| 1600 | Return PuBe source to PAN 443. |
|---|---|
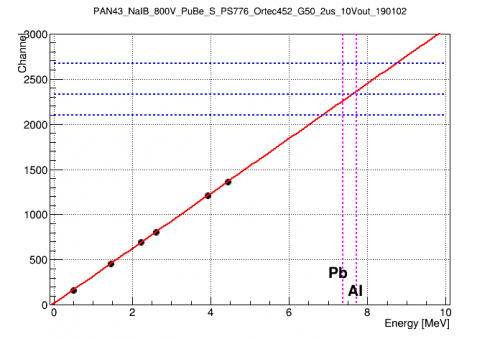
| later | Here is an example of the calibration curve obtained with the pre-amp setup at 800V. The points are identified lines, the blue lines are unidentified peaks in the spectrum and the magenta lines are expected capture lines. |
 |