2016/11/30 (Wednesday)
| Setup: DIB1/3/4 → 3.2 MHz filters → cables1/2/3 → DCRC55(1)/33(2)/50(3) | |
| 0714 | data from overnight seems to be good, no railed channels |
| 0750 | Main bath = 63.8% |
| 0800 | Last night's sequence is finished. Prepare to continue IbIs studies. |
| 0820 | Finish IbIs for DCRC3 pB |
| 0845 | Finish IbIs for DCRC3 pC |
| 0910 | Finish IbIs for DCRC3 pD |
| DCRC1 pA | DCRC1 pB | DCRC1 pC | DCRC1 pD |
|---|---|---|---|
 |  |  |  |
| DCRC2 pB | DCRC2 pC | ||
 |  | ||
| DCRC3 pB | DCRC3 pC | DCRC3 pD | |
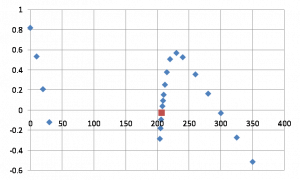 | 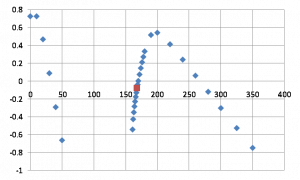 | 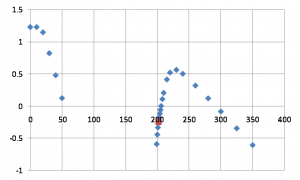 |
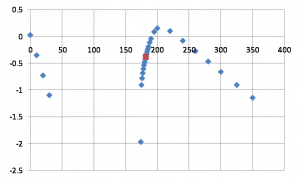
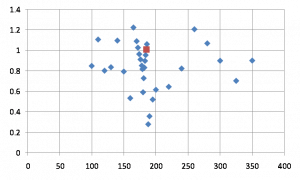
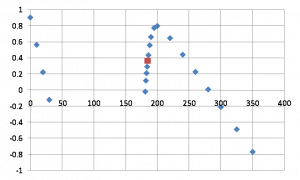
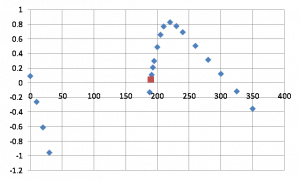
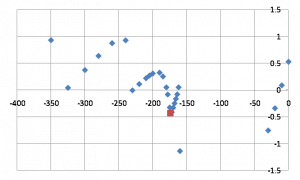
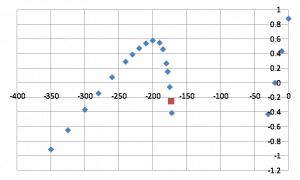
The plots above show the raw IbIs results from yesterday and today. The red points indicate the default operational bias (the Nov 15 settings). Most look quite reasonable but two are problematic - apparently the SQUID jumps phase in the normal/transition regions. This means that for these channels the previous mini-IbIs estimates are probably not reliable. This gives a partial explanation of why some channels seemed to be operating below the theoretical limit (DCRC1pB in particular).
| 1013 | Tower/MC/Coldplate = 33.2/36.0/234 mK, Still = 1.45 K / 110 μbar, G1/G2 = 189/192 mbar, 1K Pot = 1.69 K / 28 mbar. MB = 60.1%. Boil off rate: close to slow mode. |
|---|---|
| 1058 | Fill LN2 Coldtrap full. |
| DCRC1 pA | DCRC1 pB | DCRC1 pC | DCRC1 pD |
|---|---|---|---|
 | [image not archived: r61_prefactornov30_d1pb.png] | 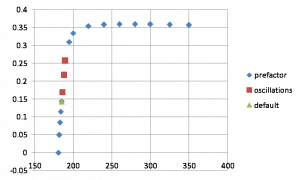 | 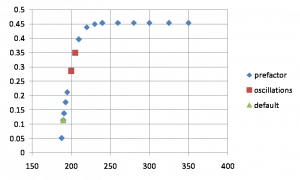 |
| DCRC2 pB | DCRC2 pC | ||
| [image not archived: r61_prefactornov30_d2pb.png] | 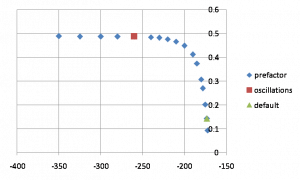 | ||
| DCRC3 pB | DCRC3 pC | DCRC3 pD | |
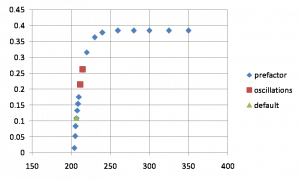 | 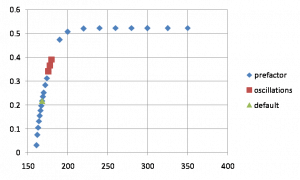 | 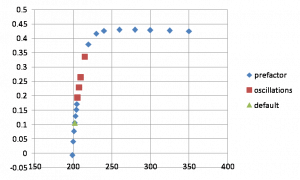 |
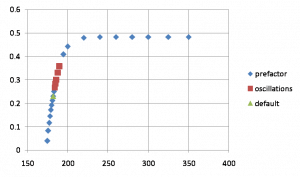
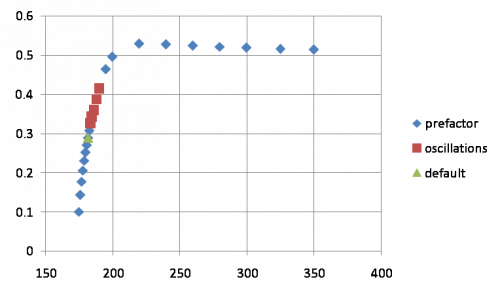
The plots above show the calculated dP/dI “prefactor” from each IbIs curve except the two messy ones. This factor is necessary for calculating the absolute absorbed-energy calibration which is needed to calculate phonon collection efficiency. These plots could be used to select a bias based on a desired prefactor.
In the limit that R_normal » R_shunt+R_parasitic, the maximum prefactor should be close to 1. The maxima above are much less than one, ranging from 0.35 to 0.5. This implies that R_normal is only 2 to 3 times greater than R_shunt+R_parasitic.
The prefactor formula is 1-2*[(V_out-V_offset)/I_bias]/[dV_out/dI_bias|superconducting]. It depends only on the shape of the IbIs curve. The greatest uncertainty arises from determining the offset voltage. This is done by extrapolating the linear normal part of the curve back to I_bias=0. This part of the curve is never exactly linear, implying the resistance is not entirely constant. It could be that at higher biases the normal resistance increases as the TES gets hotter. At biases close to the transition it could be that the resistance starts to decrease as a small part of the TES array starts to fall into transition.
If the uncertainty in the prefactor is dominated by the uncertainty in V_offset, then the relative uncertainty in prefactor is inversely proportional to I_bias and to the prefactor itself. Thus lower biases and lower prefactors increase the relative uncertainty. The plot below shows an estimate of the relative prefactor uncertainty as a function of prefactor for DCRC3 pC:
| Relative uncertainty in prefactor for DCRC3 pC |
|---|
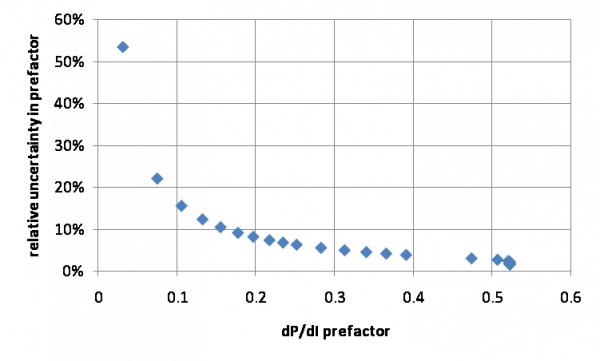 |
| Based on an estimated V_offset error of 0.05 V |
To keep the relative uncertainty below 10% we need to choose a prefactor greater than 0.2.
There is another way to measure prefactor that does not require the voltage offset, but it only works if constant power is assumed:
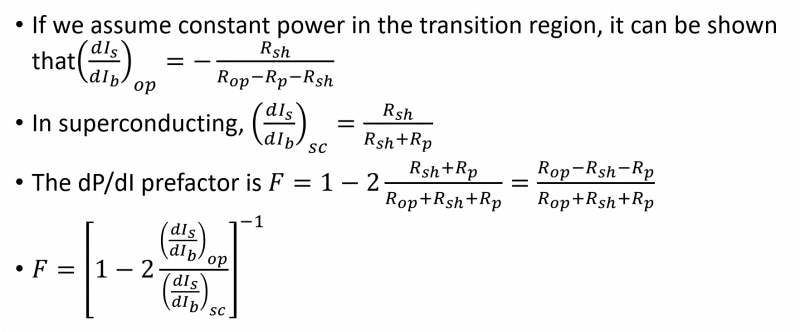
Again this calculation depends purely on the shape of the IbIs curve, independent of gains, fixed resistance values, or calibrations. But as mentioned it depends on a constant power assumption. The dIs/dIb calculation could be done using a test signal, but could also simply be estimated from the DC IbIs curve. The latter is preferable because 1) it doesn't require an additional test signal calibration and 2) on some channels the test signal doesn't work.
If this second method of calculating the prefactor works, then it will be very useful for the two channels with bad IbIs curves - we only need the portions of the curve in the vicinity of the operating point and in the superconducting region.
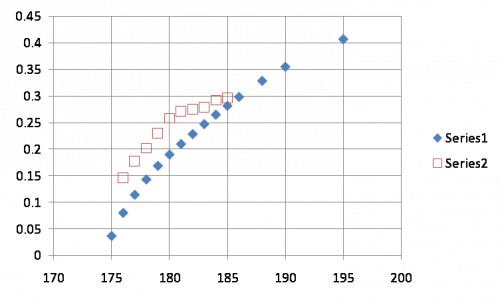
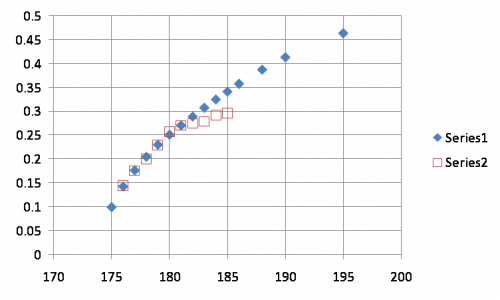
| Comparison of prefactor calculations, DCRC1 pA | |
|---|---|
| Offset voltage estimate: 2.25 V | Offset voltage estimate: 2.05 V |
 |  |
| |  |
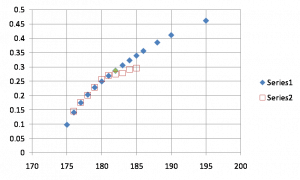
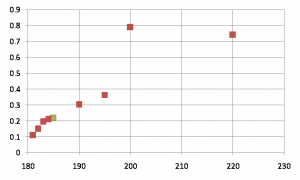
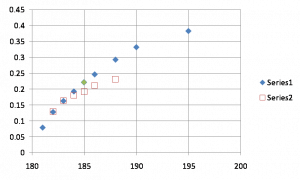
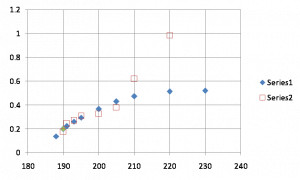
Above is a comparison of the two methods of calculating the prefactor: Series 1 based on the absolute Ib/Is at transition (and requiring the voltage offset) and Series 2 based on dIb/dIs at transition (and requiring the assumption that the power is constant). The second method follows the shape of the first method for lower points but curves downward at higher points in the transition, probably because the constant power assumption begins to fail (something similar was seen early this run when comparing resistance estimates based on Ib/Is versus dIb/dIs).
The plots on the left use the original voltage offset estimate which was based on a large flattish region in the normal part of the IbIs curve. But if the offset estimate is reduced (right side), there is much better agreement between the two prefactor calculation methods. The lower plots show the prefactor estimate over a wider range, and it is easy to compare how they are affected by the new estimation of the offset. In general they are higher, and the lowest point is not as close to 0 as it was previously. This may explain why the earlier estimates of prefactors from mini-IbIs methods were implausibly low or even negative.
The new offset estimate is not implausible, but it suggests that the part of the normal portion of the curve that should be used to make the extrapolation is much closer to the transition region, and that points further out produce a poorer estimate.
| Comparison of resistance calculations, DCRC1 pA | |
|---|---|
| Offset voltage estimate: 2.25 V | Offset voltage estimate: 2.05 V |
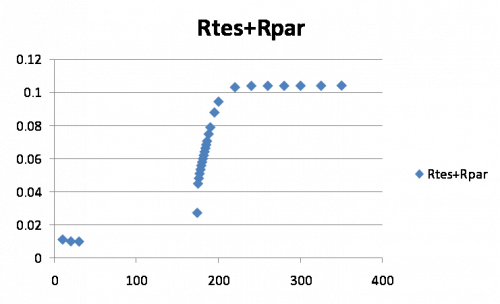 | 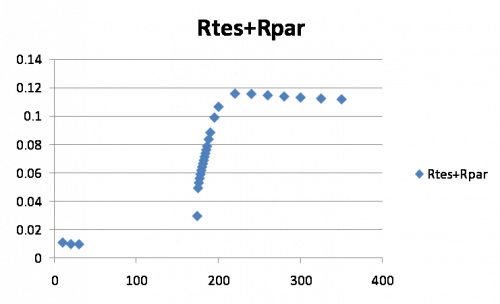 |
The plot above shows the resistance calculation using the two different offset estimates. If the newer offset is correct, it suggests that in the normal state the TES resistance decreases with increasing bias. I'm not sure whether that's plausible.
| 1515 | Setup DAQ for coincident running, make DCRC4 master, reset timing link, disable triggering on DCRC1 |
|---|
| DCRC1 pA | DCRC1 pB | DCRC1 pC | DCRC1 pD |
|---|---|---|---|
 |  |  |  |
| DCRC2 pB | DCRC2 pC | ||
 |  | ||
| DCRC3 pB | DCRC3 pC | DCRC3 pD | |
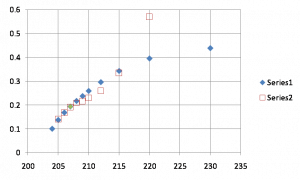 | 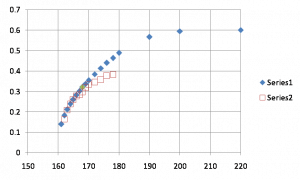 | 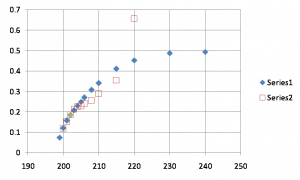 |
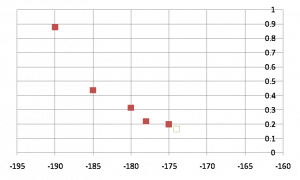
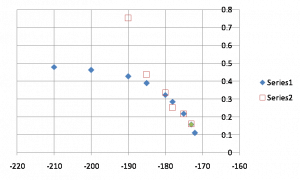
The plots above show the prefactors calculated both ways, with the voltage offset adjusted to line them up as described earlier. All of the adjustments are qualitatively similar to the example described. Also shown in green in each plot is the standard QET bias setting as listed on Nov 15.
In the two cases where the full IbIs curve is unusable due to phase shifts in the SQUID lock, only the dIb/dIs method is shown. In one of these cases (DCRC2 pB) the actual operational setting is close to a shift point so the dIb/dIs can not be easily calculated, so this point is an extrapolation.
Addendum: the constant power assumption is actually only approximate. In Matt Pyle's thesis he states that dP/dIb = m*Rsh*Is. m is close to zero if alpha is large: m = (2+beta)/(1+beta+alpha/n), where alpha and beta are the temperature and current sensitivities of the TES resistance and n is the temperature coefficient of the thermal conductivity. Noah has estimated alpha=65 and beta=0.2 for one channel of this detector, which gives m = 0.14, which is not very small. This suggests that the TES power varies by about a pW when Ib changes by a few uA. This non-zero m makes the absolute value of the Is-versus-Ib slope greater than it otherwise would be, which has the effect of making the prefactor appear larger than it actually is. This, along with comparisons of data taken at two different sets of QET biases, suggests that the non-corrected voltage offsets are probably more correct.
| 1715 | Fill LN2 cold trap ALMOST full. After a few minutes flow slowed/stopped. I think this dewar is empty? Regardless, it filled for several minutes before stopping so it is good enough for tonight. Dewar will have to be filled tomorrow morning. |
|---|