2016/11/28 (Monday)
| Setup: DIB1/3/4 → 3.2 MHz filters → cables1/2/3 → DCRC55(1)/33(2)/50(3) | |
| 0820 | Main bath = 66.8% |
| 0825 | Return 88Y source to safe |
| 0840 | DCRC1pB is railed. Other channels look OK. Unrailed DCRC1pB by adjusting driver offset. |
| 0840 | DCRC1pB railed very soon after the beginning of the coincident data set by 17:00 on 11/25 it was railed. |
| 1035 | Finish IbIs measurements on DCRC1 channels |
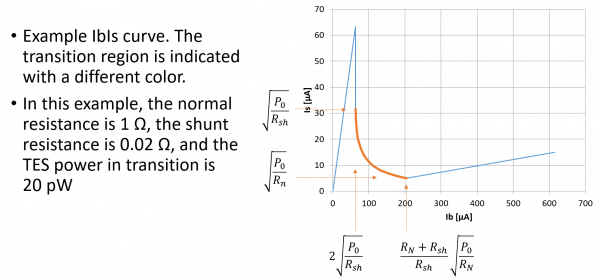
On some channels at the lower biases, the dP/dI prefactor is coming out negative, indicating Rtes(biased) < Rsh+Rpar which is impossible because it would not be stable. From yesterday's notes it is clear that this calculation does not depend on knowing the shunt resistance and does not depend on accurate knowledge of any gains or calibrations in the output signal or applied bias. The prefactor comes purely out of the shape of the IbIs curve. One possible problem is the calculation of the voltage offset, which must be done by fitting the normal part of the IbIs curve. Maybe this introduces significant error.
| 1050 | Tower/MC/Coldplate = 33.2/34.6/222 mK, Still = 1.25 K / 110 μbar, G1/G2 = 195/210 mbar, 1K Pot = 1.69 K / 26 mbar. MB = 63.2%. Boil off rate: a bit faster than slow-mode. |
|---|---|
| 1055 | Fill LN2 cold trap bath. |
| 1310 | Finish IbIs measurements on DCRC3 channels |
| 1400 | Finish IbIs measurements on DCRC2 channels |
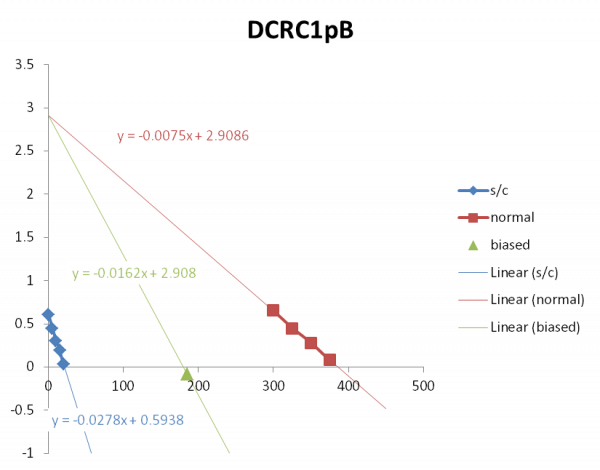 |
This is an example of the mini-IbIs procedure. This is raw data, output voltage [V] versus QET bias [μA]. A few points are taken in superconducting and in normal states. One point is taken at the chosen bias. The same driver offset is used for the normal and biased cases. The normal part is extrapolated backward to find the voltage offset, in this case 2.9086 V. (There is a different offset in the superconducting region, because the SQUID is generally in a different phase.)
The three slopes shown should give the resistance for the three cases, with the proper calibration and gain factors applied including Rshunt. The ratio of the biased and superconducting slopes can be used to find the factor described in yesterday's notes, independent of any calibration or gain factors or Rshunt.
In this particular case the ratio of the biased and superconducting slopes is greater than 0.5. This shouldn't be possible. At the very bottom of the transition region the ratio should be 0.5 and it should be smaller as the operating resistance increases toward the normal resistance. In this case the ratio would be 0.26 at the top of the transition, when the operating resistance is near the normal resistance.
 |  |  |  |
 |  | ||
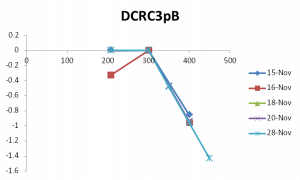 | 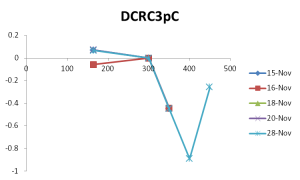 | 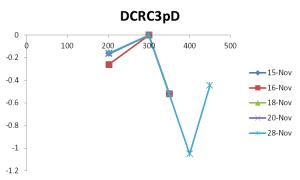 |
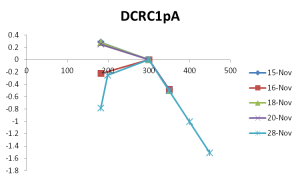
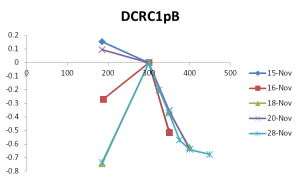
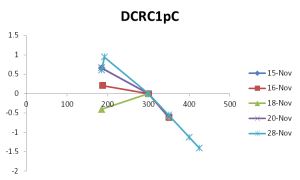
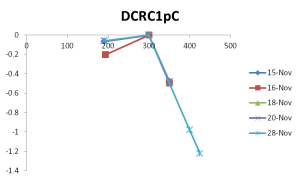
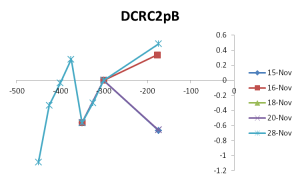
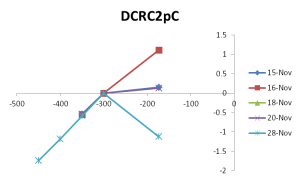
Above are IbIs data points in the normal and biased regions for each channel, taken on different days for comparison. The curves have been shifted so that the 300 μA point is at zero.
For the most part the slope of the normal regime is the same from measurement to measurement. But the position of the biased point can differ a lot. An explanation we've used in the past is that the noise environment can change so that different amounts of parasitic power are present - this in turn modifies the TES power constant that the feedback circuit locks onto. So this would shift the entire transition region of the IbIs curve.
There are a few patterns. Nov 16 seems to be an outlier in all cases. In DCRC2, Nov 15&20 are in good agreement, with the 16th and 28th as outliers; in DCRC3, Nov 15&20&28 are in good agreement, with the 16th as an outlier. In DCRC1 there are also dates in which the bias points agree but the pattern is different with each channel (although the 16th is an outlier in all of them).
| 1720 | Return all channels to standard driver gains, x8 on DCRC1&3, x3 on DCRC2. Return all QET biases to Nov 15 values. |
|---|---|
| 1725 | Fill LN2 cold trap bath |
| 1725 | Main Bath = 53.6% |