2016/11/16 (Wednesday)
| Setup: DIB1/3/4 → 3.2 MHz filters → cables1/2/3 → DCRC55(1)/33(2)/50(3) | |
| Overnight: taking data with coincidence trigger from NaI detector, 88Y source in lead castle behind fridge A quick look at the last data series this morning shows that the channels are all in good shape, good pulses. |
|
| 0915 | Remove 88Y source from behind fridge and replace in safe. |
| 1000 | Re-measuring Rtes using dIb/dIs (test signal) with the constant-power assumption. As before we're finding that the test signal won't connect on DCRC2 (revC) using the SQUID tuning gui. On DCRC1 there's the weird bug that when you connect to pA it also seems to connect to pB, and if you then actually try to connect it to pB it disconnects. |
| 1015 | Tower/MC/Coldplate = 33.2/36.0/200 mK, Still = 1.1 K / 110 μbar, G1/G2 = 185/175 mbar, 1K Pot = 1.70 K / 30 mbar. MB = 27.7%. Boiloff rate: A bit faster than slow-mode. |
| 1045 | Start LHe transfer (27.1%) |
| 1120 | Finish LHe transfer (89.1%) |
| 1135 | Released pressure from MB. |
| 1200 | Remeasuring Rparasitic using dIb/dIs (test signal). Now there is more trouble connecting the test signals: can't get them to connect on DCRC1pC or DCRC3pC or DCRC3pD. These worked earlier. |
| 1210 | Re released pressure from MB. |
| 1230 | Re released pressure from MB. |
| Test sig 18mVpp 200Hz | dIb/dIs | IbIs | dIb/dIs vs IbIs | |||||
|---|---|---|---|---|---|---|---|---|
| channel | signal @ bias [mVpp] | signal @ Ib=0 [mVpp] | Rpar [mΩ] | Rtes [mΩ] | Rpar [mΩ] | Rtes [mΩ] | Rpar ratio | Rtes ratio |
| DCRC1pA | 310 | 260 | 10.4 | 63.3 | 9 | 53.8 | 1.16 | 1.18 |
| DCRC1pB | 359 | 256 | 11 | 59.9 | 8.5 | 46.9 | 1.28 | 1.28 |
| DCRC1pC | 479 | 11.9 | 54.5 | 9.8 | 42.4 | 1.29 | ||
| DCRC1pD | 427 | 241 | 13.1 | 58.1 | 11.3 | 45.3 | 1.16 | 1.28 |
| DCRC2pB | 11.9 | 30.6 | ||||||
| DCRC2pC | 11.4 | 50.6 | ||||||
| DCRC3pB | 525 | 216 | 17.4 | 58.5 | 14.4 | 61.9 | 1.21 | 0.94 |
| DCRC3pC | 379 | 17.7 | 65.3 | 14.7 | 40.1 | 1.63 | ||
| DCRC3pD | 639 | 16.5 | 54.5 | 13.7 | 38.9 | 1.4 | ||
The table above shows results of resistance measurements with dIb/dIs method, and compares to yesterday's IbIs results. Blank spaces indicate where the test signal could not be connected.
There is a systematically higher value estimated using dIb/dIs. For Rpar the average ratio is 1.20 for those measured. For those that could not be measured I assumed the same systematic difference - those are the italicized values.
There are a couple of outliers in the systematic difference between the two Rtes measurements, particularly DCRC3pB (for which the dIb/dIs estimate is actually smaller) and DCRC3pC.
| 1655 | Finish redoing IbIs measurements of TES resistances, repeat of yesterday's measurements. Since this morning, several channels now require higher QET biases than before to keep them in transition - DCRC1pB,pC,pD and DCRC2pB. All are now a few μA higher. Indicated in bold below. |
|---|
| IbIs results | ||||||
| Channel | QET bias [μA] | Rpar [mΩ] | Rn [mΩ] | Rop [mΩ] | Rop/Rn | Rop/(Rsh+Rp) |
|---|---|---|---|---|---|---|
| DCRC1pA | 182 | 8.84 | 96.2 | 39.9 | 41.4% | 1.21 |
| DCRC1pB | 188 | 8.41 | 87.9 | 36.9 | 42% | 1.14 |
| DCRC1pC | 187 | 9.37 | 67.7 | 33.4 | 49.4% | 1 |
| DCRC1pD | 193 | 11.21 | 90.8 | 40.7 | 44.8% | 1.16 |
| DCRC2pB | -177 | 11.9 | 102 | 54.4 | 53.4% | 1.52 |
| DCRC2pC | -173 | 11.39 | 106.1 | 87.8 | 82.8% | 2.48 |
| DCRC3pB | 207 | 14.1 | 91.1 | 42 | 46.1% | 1.1 |
| DCRC3pC | 165 | 13.66 | 102.8 | 37.9 | 36.9% | 1.01 |
| DCRC3pD | 202 | 13.44 | 82.3 | 37 | 44.9% | 0.99 |
Comparing to yesterday, the parasitic resistances are close to the same and the normal resistances are close too (DCRC3pB is an outlier, somewhat lower Rnormal today). But the operating point TES resistances are all quite different today. One might suspect that the channels with modified QET biases would be different, but as it turns out that is not very relevant: the pattern is that the resistances are lower today on DCRC1&3, and they are higher on DCRC2. DCRC2 is the RevC board, the others are RevC.1. Along with the change in the operating biases, it seems as though the real difference may be a change in parasitic power from the DCRCs, varying with the DCRC.
The Rop values from DCRC1&3 are smaller today by an average of 17%. The values from DCRC2 are larger by an average of 76%.
I get the impression that things have changed since the attempts at dIb/dIs measurements today. There were also the problems with connecting and failing to connect the test signals, which changed during the measurement - another indication that something about the DCRCs has changed.
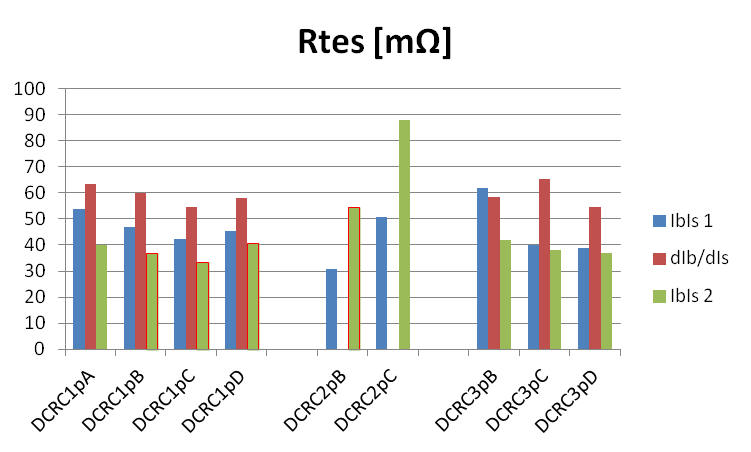 | 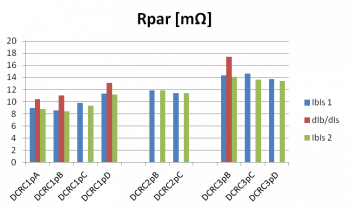 | 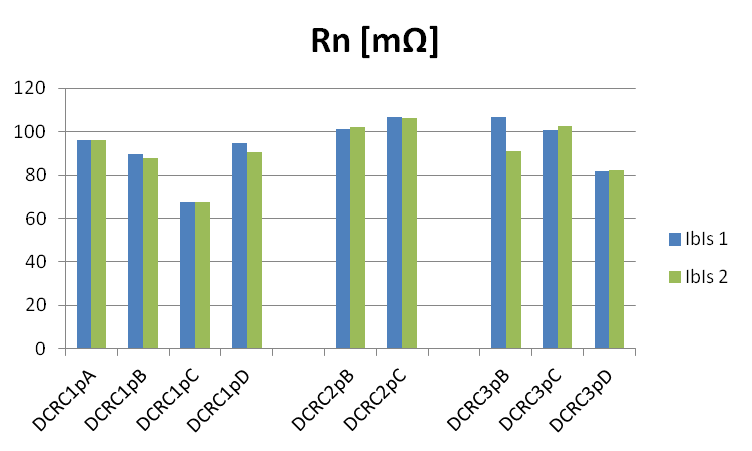 |
The fact that the Rtes values are close to Rshunt+Rpar has a big impact on attempting to calculate phonon collection efficiency. For the absolute calibration of absorbed phonon energy you need to know dP/dI, the relationship between absorbed power and signal current. Rtes appears in a prefactor in this calculation:
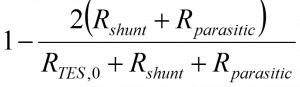
If Rtes were large compared to Rshunt+Rpar, this factor would be close to 1 and relatively insensitive to errors in the Rtes measurement. But in the current case the prefactor is quite sensitive to the different measurements, as shown below:
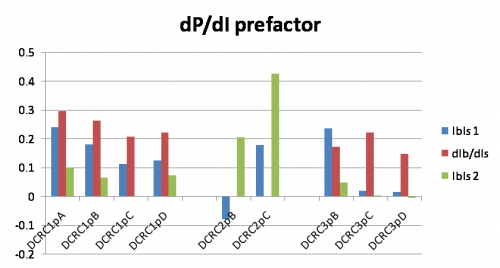 |
The negative values cannot be correct - these are the cases where the measurements indicate Rtes<Rshunt+Rpar, which cannot be the case.
| 1730 | Fill LN2 coldtrap full. LHe bath level at 83.9%. |
|---|---|
| 1920 | Tried to set up data for overnight running, saw oscillation on DIB1 PD, upon attempting to fix it the DAQ kept killing the frontends, tried disconnecting all telnet sessions and reconnected. This didn't work, probably need a DAQ restart. gave up. |