2014/05/27
| 0210 | Mixing chamber heater power 200 μW. Tower temperature appears to have stabilised at 285 mK. Commence data acquisition: ionisation-only; -/+3.5 V & +/-3.5 V biases; one 30-minute file at each bias; interspersed by 6-second flash and 20-minute cooldown; OR charge trigger at 40 ADC bins. |
| 0225 | Fill N2 cold trap full. Confusingly, tower temperature has started to rise again. Very small change, but one normally witnesses it falling after filling the nitrogen cold trap. Can't think why this is happening, but it is a little late. Rate of temperature increase is rather slow. Will see what situation is like later. |
| 0300 | Tower temperature rose to 291 mK before falling again. |
| 0600 | Mixing chamber heater power 400 μW. Tower temperature appears to have stabilised at 454 mK. Commence data acquisition: ionisation-only; -/+3.5 V & +/-3.5 V biases; one 30-minute file at each bias; interspersed by 6-second flash and 20-minute cooldown; OR charge trigger at 40 ADC bins. |
| 1050 | Tower temperature has been rising for a while. Fortunately, aforementioned data acquisition occurred before tower temperature started to rise, and therefore data collected should be fine. Noticed 1 K pot was very warm at 4 K and pressures in G1 & G2 very high at around 600 mbar. Scroll pump evacuating the 1 K pot seems to be working fine. Assume that the pot has emptied. Open needle valve a little more. Appears to do the trick as the 1 K pot temperature plummets. Although mixture pressure is rather high and therefore a lot of stress is being placed on 1 K pot, decide not to interrupt circulation: she should be able to take it. Wait for mixture to recondense and reassess situation. |
| 1105 | Fill N2 cold trap full. |
| 1210 | Tower temperature appears to have returned to around 440 mK. Its stability is still in question, but it is probably fine to increase power to mixing chamber heater. Increase mixing chamber heater power to 600 μW. |
| 1325 | Temperature of 1 K pot 1.64 K. Appears to be holding steady. Fine for our current base temperature. Fortunately, we are close to the end of this run. |
| | Tower temperature is still a little unstable, varying between 625 mK and 631 mK. However, we are running out of helium. Commence data acquisition at tower temperature of 629 mK: ionisation-only; -/+3.5 V & +/-3.5 V biases; one 30-minute file at each bias; interspersed by 6-second flash and 20-minute cooldown; OR charge trigger at 40 ADC bins. |
| 1540 | Tower temperature appears to have stayed around 620-630 mK during previous data series. Increase mixing chamber power to 800 μW. |
| 1640 | Tower temperature appears to have stabilised at 851 mK, but it is a little early to state this. Nevertheless, let's press on. Commence data acquisition at tower temperature of 629 mK: ionisation-only; -/+3.5 V & +/-3.5 V biases; one 30-minute file at each bias; interspersed by 6-second flash and 20-minute cooldown; OR charge trigger at 40 ADC bins. |
| 1940 | Helium liquid level 1.0%: we're running out of time. Turn off mixing chamber heater and interrupt circulation by closing valve V6 on IGH. Open valve V3 on IGH to fill fridge from both sides and wait for mixture to get close to 1 K pot temperature of 1.63 K. |
| 2255 | Helium level is too low, and therefore lost 1 K pot. Unfortunately, this means end of run. Close valves V3 & V13A, and open valves V5, V6 & V9 to recover mixture. |
| 2320 | Fill N2 cold trap full. |
| | Stop 1 K pot. |
Data Analysis of Higher Temperature Runs
While warming up the fridge, we collected ionization only data at a range of higher temperatures in order to determine if flashing the detector at a higher base temperature can still neutralize the crystal and whether or not the crystal deneutralizes sooner when at these higher temperatures. The base temperatures studied, as determined by the tower thermometer, are 75 mK, 105 mK, 290 mK, 455 mK, 630 mK, 850 mK, and 1.68 K. However, the data taken at 1.68 K was neutralized differently than expected.
We used detector G106a, which is a 100 mm iZIP with 12 phonon channels and 4 charge channels. There are six phonon channels and two charge channels on each side. The charge channels are patterned with an inner (Qi) and outer (Qo) ring. The fridge was protected from external neutral and gamma-ray sources by an external shield of 8 inches of polyethylene and 1.25 inches of lead on each side of the fridge.
| Table 1: An overview on the data sets taken. |
| Date | Time | Bias | Temperature |
| 2014/05/26 | 13:32 | -/+ 3.5 V | 75 ± 2 mK |
| 2014/05/26 | 14:24 | +/- 3.5 V | 75 ± 2 mK |
| 2014/05/26 | 17:34 | -/+ 3.5 V | 105 ± 5 mK |
| 2014/05/26 | 18:25 | +/- 3.5 V | 105 ± 5 mK |
| 2014/05/27 | 02:09 | -/+ 3.5 V | 290 ± 5 mK |
| 2014/05/27 | 03:00 | +/- 3.5 V | 290 ± 5 mK |
| 2014/05/27 | 06:00 | -/+ 3.5 V | 455 ± 5 mK |
| 2014/05/27 | 06:51 | +/- 3.5 V | 455 ± 5 mK |
| 2014/05/27 | 13:27 | -/+ 3.5 V | 630 ± 5 mK |
| 2014/05/27 | 14:19 | +/- 3.5 V | 630 ± 5 mk |
| 2014/05/27 | 16:40 | -/+ 3.5 V | 850 ± 5 mK |
| 2014/05/27 | 17:31 | +/- 3.5 V | 850 ± 5 mK |
At each temperature, the crystal was biased once at +/- 3.5V and once at -/+ 3.5 V. At the start of each data series, the detector was flashed with 4 LEDs for six seconds. Data was acquired for a period of 30 minutes at each bias and temperature. The base temperature was increased by increasing the power to the mixing chamber heater.
For the +/- 3.5 V bias, side 1 was biased to +3.5 V and collected electrons. Side 2 was biased to -3.5 V and collected electron holes. The -/+ 3.5 V bias is opposite. The collimated, 20 Bq Americium-241 source was always placed on side 1. Because the 60 keV gammas from the Americium source have a mean-free-path of around 1 mm, in order to see an event on side 2, the charge carriers must cross the width of the crystal. A 10 Bq Lead-210 source was also present on the same side as the Americium-241.
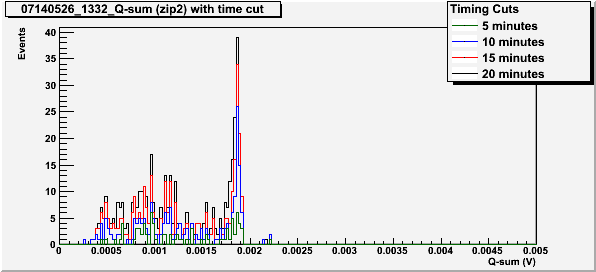
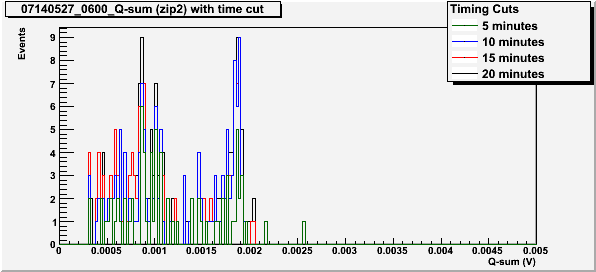
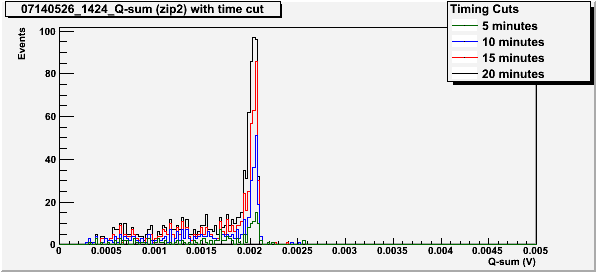
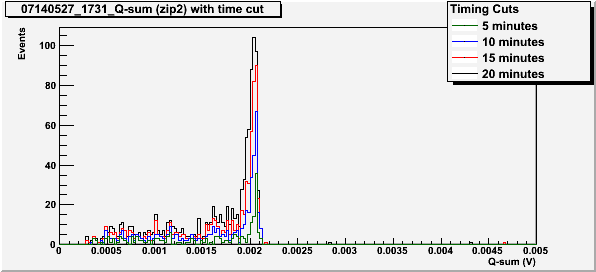
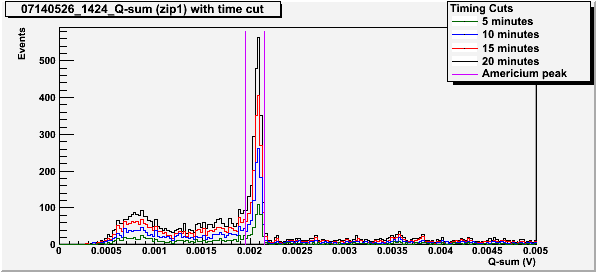
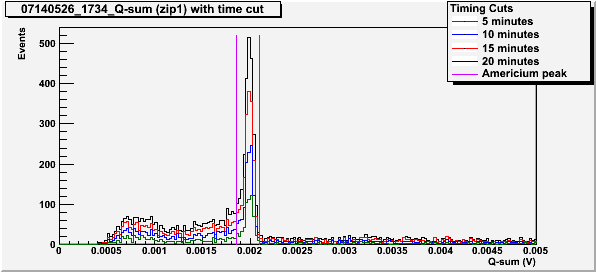
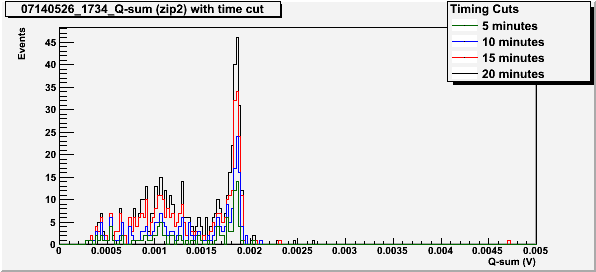
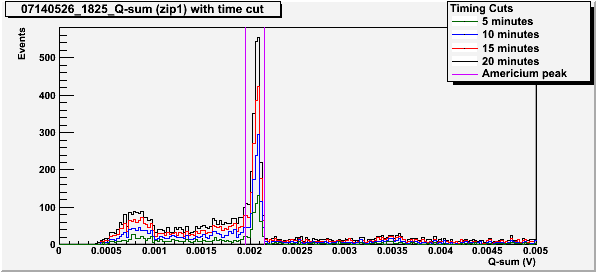
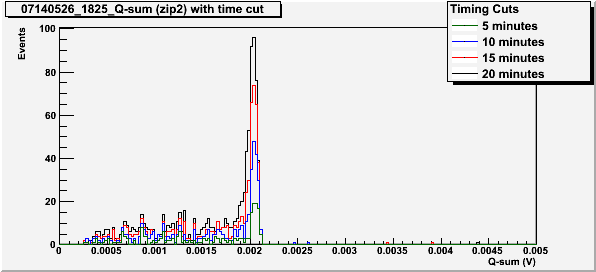
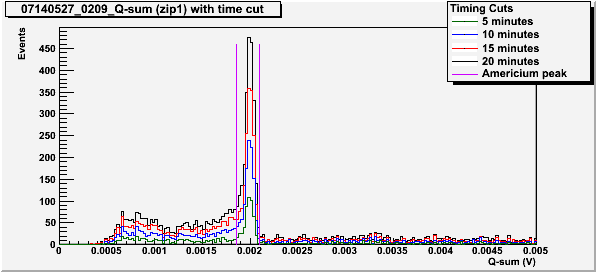
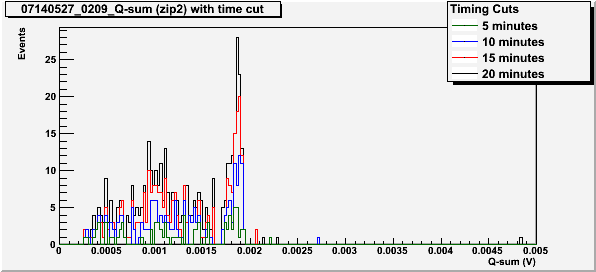
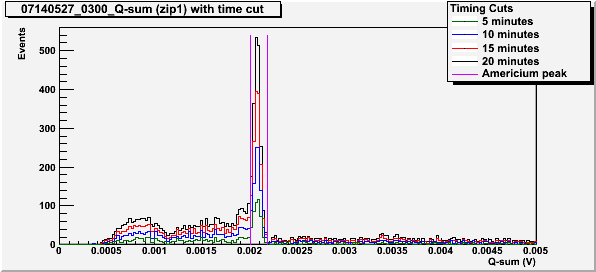
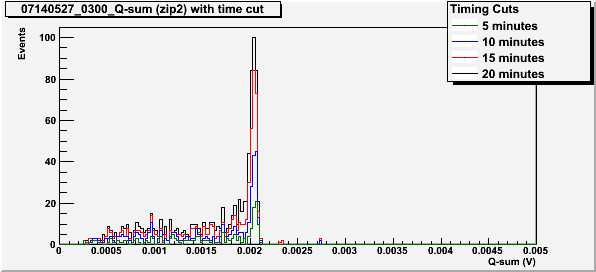
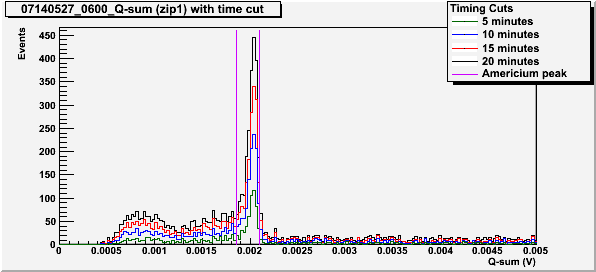
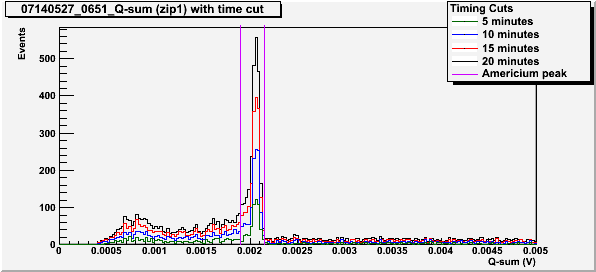
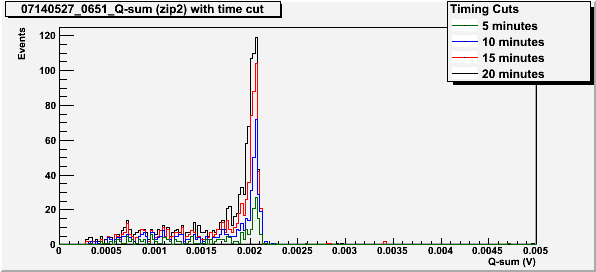
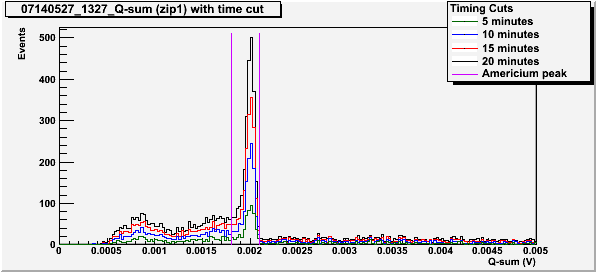
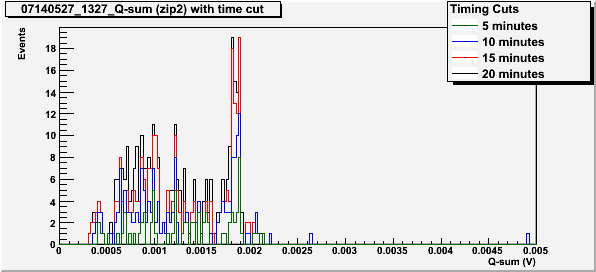
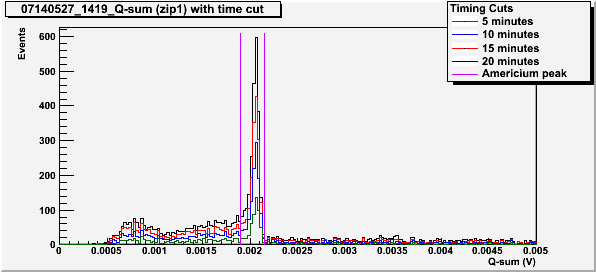
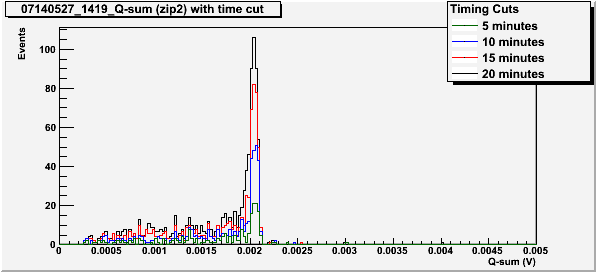
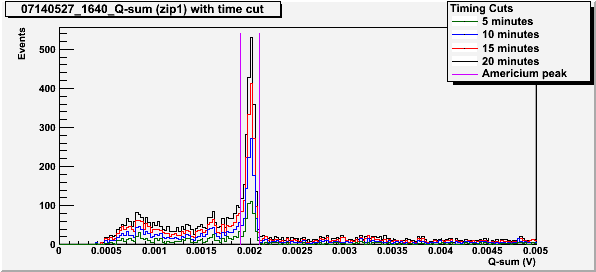
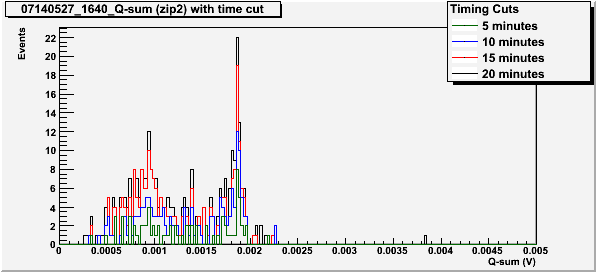
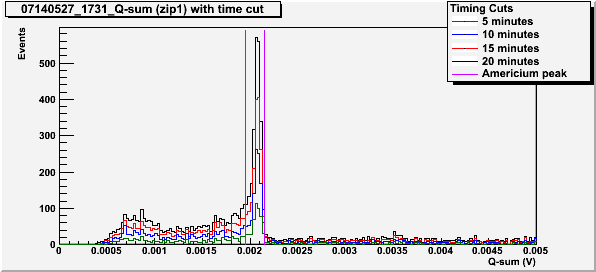
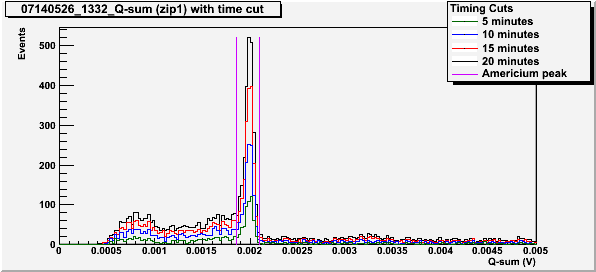
The Q-sum (Qi+Qo) spectra show whether or not the 60 keV peak is visible on side 2. These plots were created with a low energy cut such that only data with Q-Sum > 0.25 mV is considered. This cut is used to remove events that arise from noise in the electronics. A charge partition cut is also used to remove events that occur near the surface of the crystal (the data used is at least 90% in the inner charge channel). The data is also cut by the chi-squared of the fit of the pulse. The q-sum spectra on side 2 also only includes events that contribute to the 60 keV peak on side 1 with all of the aforementioned cuts as well. An example of this cut is shown in Figure 1 by the violet lines.
| Figure 1: Example of side 1 spectra to show cut on 60 keV peak. (T = 75 mK, -/+ 3.5V bias) |
 |
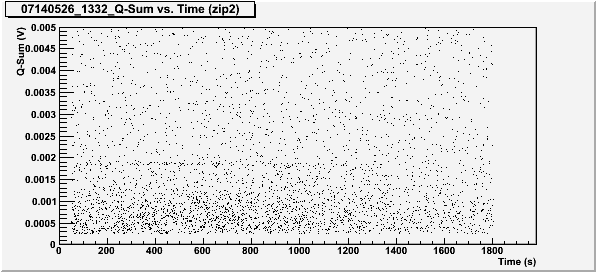
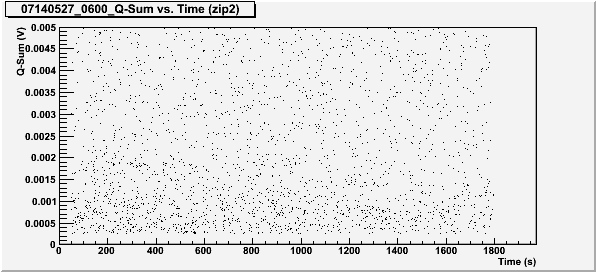
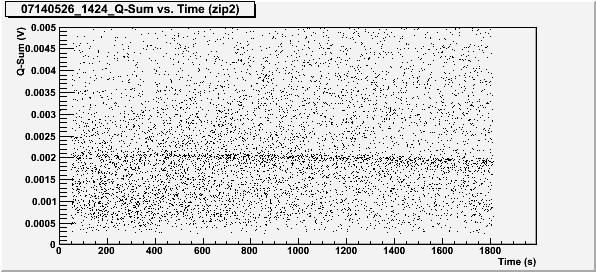
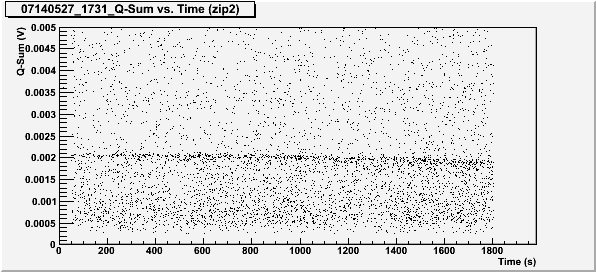
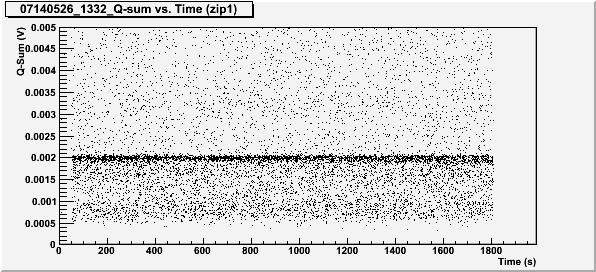
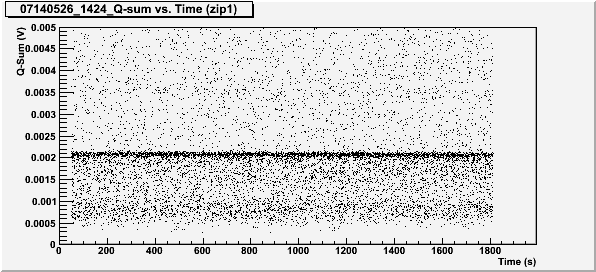
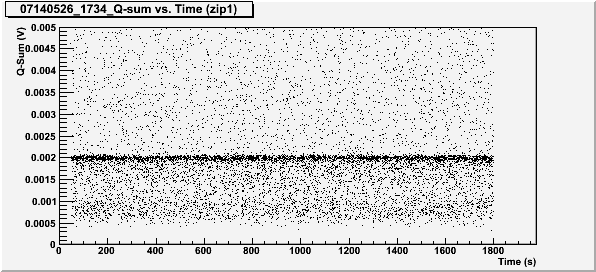
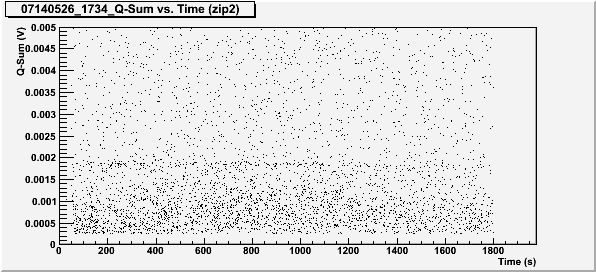
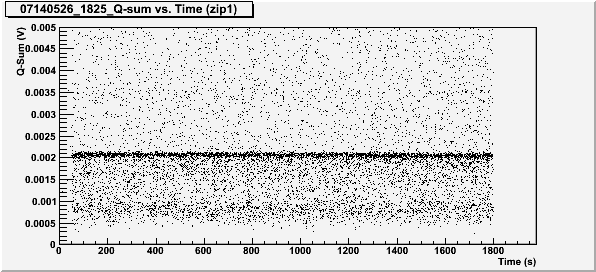
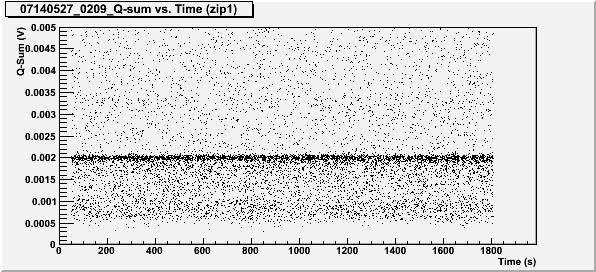
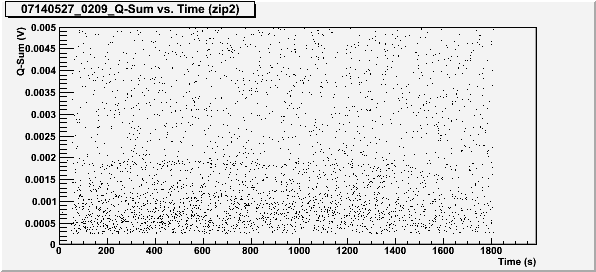
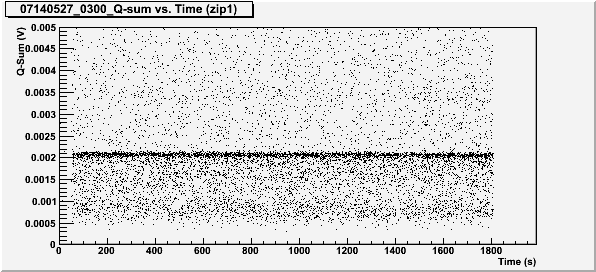
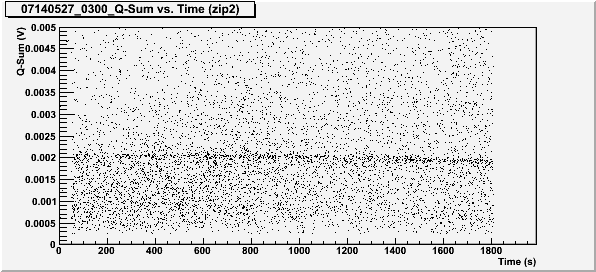
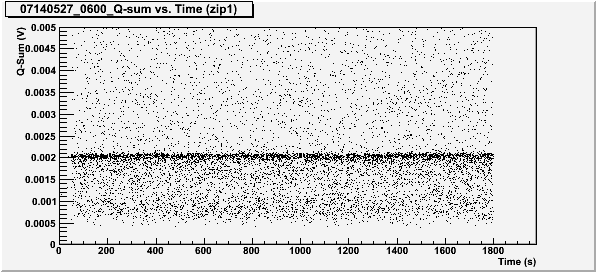
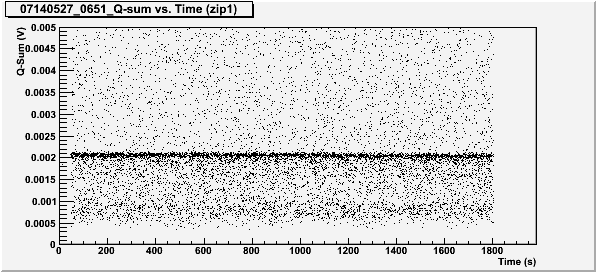
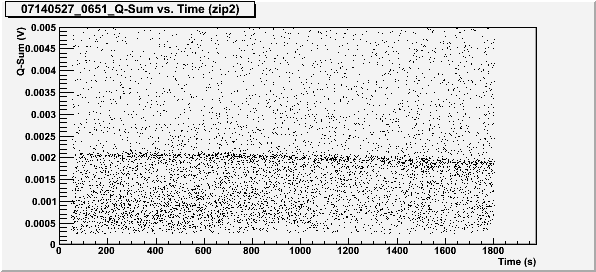
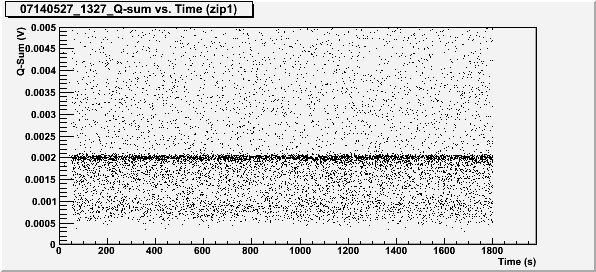
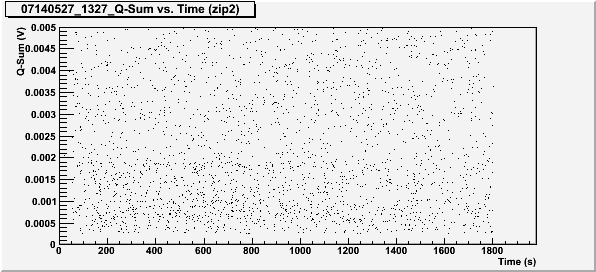
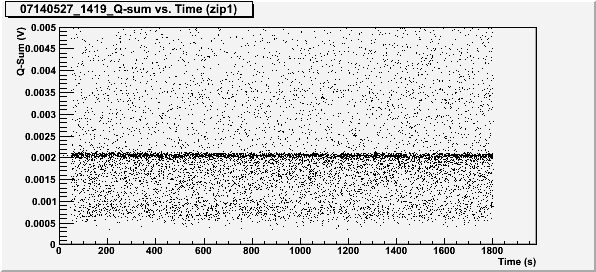
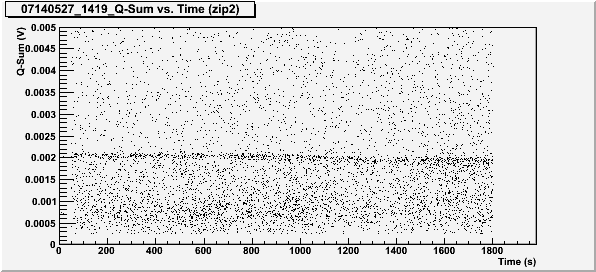
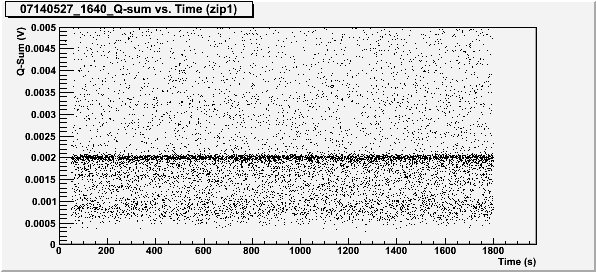
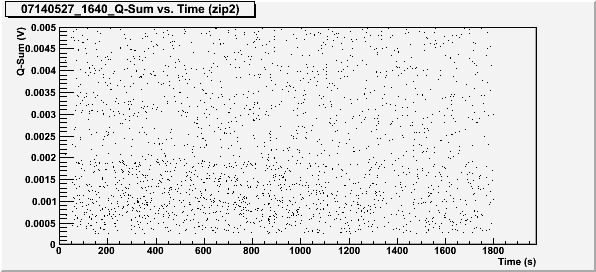
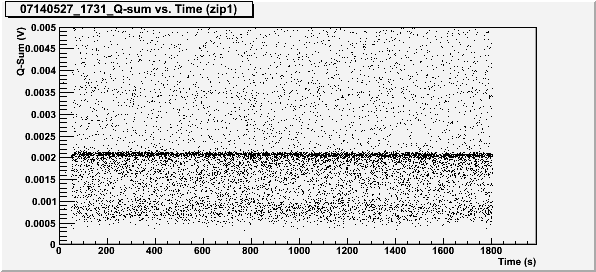
The q-sum versus time plots were used to show whether or not the crystal was losing its neutrality. For example, the 60 keV peak is usually visible as a dense line of points around 0.002 V. If the crystal stayed neutral, this line would have a fairly constant thickness and would stay around 0.2 V. If the crystal is becoming deneutralized, the thickness of this line would increase and turn down from 0.2 V.
Data series biased to -/+ 3.5 V
Data series biased to +/- 3.5 V
Conclusions
When the crystal is biased such that the side furthest from the source (side 2) collects electrons, the 60 keV peak from Americium-241 is not visible on the Q-sum vs. time plots (Figures 4, 12, 20, 28, 36, and 44) even when the 60 keV peak can be somewhat seen in the first 20 minutes on the Q-sum spectra (Figures 2, 10, and 18).
For Q-Sum vs time plots when electron holes are collected on the side furthest from the source (side 1), the 60 keV peak is visible near 0.002 V. In all cases (shown in Figures 8, 16, 24, 32, 40, and 48), the peak begins to thicken or drop somewhere around 20 minutes. This suggests that the deneutralization of the crystal did not change with temperature for this temperature range (75 mK to 850 mK). It appears that we are able to successfully neutralize the crystal within this entire temperature range using the standard flashing times.
Q-sum Spectra and Q-sum vs. Time Plots at other Biases and Temperatures
Included below are are all of the Q-sum Spectra and Q-Sum vs. Time plots for each bias and temperature.
T = 75 mK, Bias = -/+ 3.5 V
T = 75 mK, Bias = +/- 3.5 V
T = 105 mK, Bias = -/+ 3.5 V
T = 105 mK, Bias = +/- 3.5V
T = 290 mK, Bias = -/+ 3.5V
T = 290 mK, Bias = +/- 3.5 V
T = 455 mK, Bias = -/+ 3.5 V
T = 455 mK, Bias = +/- 3.5 V
T = 630 mK, Bias = -/+ 3.5 V
T = 630 mK, Bias = +/- 3.5 V
T = 850 mK, Bias = -/+ 3.5 V
T = 850 mK, Bias = +/- 3.5 V