2014/3/19
| 1200 | Fill LN2 cold trap. |
|---|---|
| 1230 | Commence helium transfer. Helium liquid level at 6.9%. |
| 1343 | Finish helium transfer. Helium liquid level at 93.3% |
| 1435 | Mixing chamber temeprature 1.68 K. Commence manual condensation procedure. |
| 1505 | Manual circulation procedure complete: valve V6 fully open. Wait for mixing chamber to cool to base temperature. |
| 2300 | Fill N2 cold trap full. |
| Mixing chamber temperature 63.6 mK. Switch to tower thermometer. Tower temperature 72 mK. Flash detector overnight: LEDs 1 & 2 on DIBs 1 & 2; usual settings (current -0.6 mA, flash-on time 100 μs; flash-off time 5 ms. | |
| 2325 | Tower temperature appears to be holding steady at a little over 420 mK. Looks fine. |
Data Analysis
Data from 8:13 am
The data taken at 8:13 am was taken at 1.68K. Side 1 (zip 1) collected electron holes and side 2 (zip 2) collected electrons. The source is on side 1.
| Figure 1: QSum spectra for zip 1 |
|---|
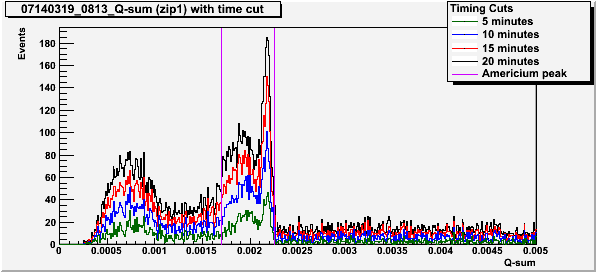 |
Figure 1 shows the spectra of total charge collected (qSum) on side 1 with a low energy cut on side 1, a charge partition cut on side 1, and a chi-squared cut on side 1 for four different time periods. The low energy cut only includes qSum > 0.00025 V. The partition includes data that is at least 90% in Q-inner versus Q-outer. In this case, the Americium peak has been defined by the violet lines from qSum = 0.0017 V to qSum = 0.00225 V. The Americium peak appears to have a double peak that doesn't change over the first 20 minutes of the run.
| Figure 2: QSum spectra for zip 2 |
|---|
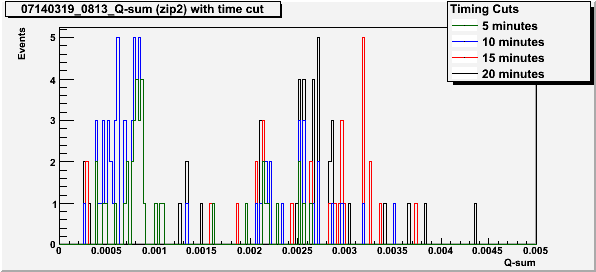 |
Figure 2 shows the spectra of total charge collected (qSum) on side 2 with a low energy cut on side 2, a charge partition cut on side 2, and a chi-squared cut on side 2 for four different time periods such that it only includes data within the Americium peak defined in the qSum spectra for zip 1.This means it also includes all of the same cuts as the QSum spectra for zip 1 as well as for zip 2.
The Americium peak is not really visible on this plot.
| Figure 3: Q-Sum vs. Time for zip 1 |
|---|
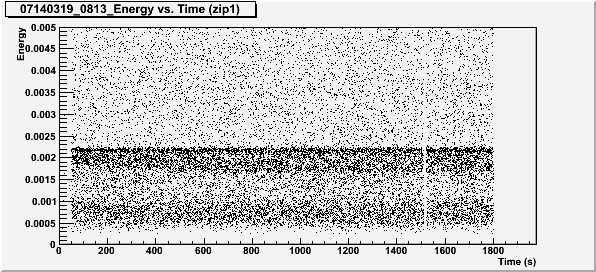 |
Figure 3 shows qSum vs. time for side 1 with a low energy cut for side 1, a charge partition cut on side 1, and a chi-squared cut on side 1. The Americium peak is visible as the thick line around an energy 0.002 V. It appears to thicken slightly as time progresses, which suggests the crystal is becoming less neutral.
| Figure 4: Q-Sum vs. Time for zip 2 |
|---|
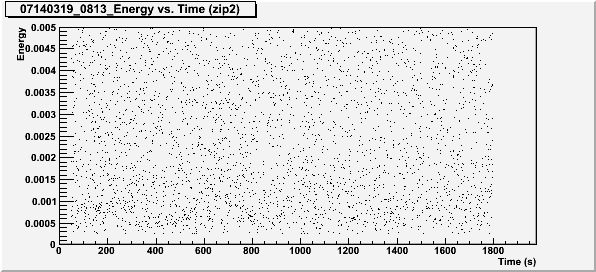 |
Figure 4 shows energy vs. time for side 2 with a low energy cut for side 2, a charge partition cut on side 2, and a chi-squared cut on side 2. The Americium peak is not visible in this plot.
Data from 9:55 am
The data taken at 9:55 am was taken at 1.68K. Side 1 (zip 1) collected electrons and side 2 (zip 2) collected electron holes. The source was placed on side 1.
| Figure 5: QSum spectra for zip 1 |
|---|
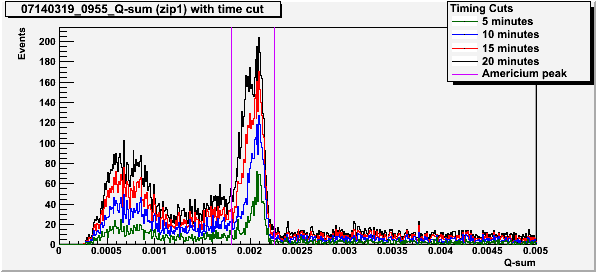 |
Figure 5 shows the spectra of total charge collected (qSum) on side 1 with a low energy cut on side 1, a charge partition cut on side 1, and a chi-squared cut on side 1 for four different time periods. In this case, the Americium peak has been defined by the violet lines from qSum = 0.0018 V to qSum = 0.00225 V. The Americium peak appears to have a double peak that appears after the first 15 minutes or so. The Americium peak is very clear in the first 5 minutes.
| Figure 6: QSum spectra for zip 2 |
|---|
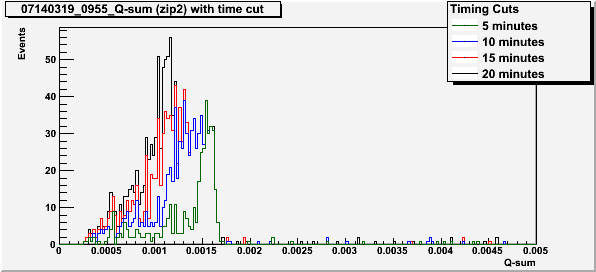 |
Figure 6 shows the spectra of total charge collected (qSum) on side 2 with a low energy cut on side 2, a charge partition cut on side 2, and a chi-squared cut on side 2 for four different time periods such that it only includes data within the Americium peak defined in the qSum spectra for zip 1.This means it also includes all of the same cuts as the QSum spectra for zip 1 as well as for zip 2.
The Americium peak is very clear in the first 5 minutes. It is not visible in the plots for the first 10 minutes or more.
| Figure 7: Q-Sum vs. Time for zip 1 |
|---|
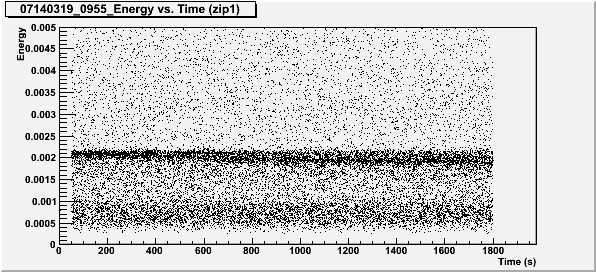 |
Figure 7 shows qSum vs. time for side 1 with a low energy cut for side 1, a charge partition cut on side 1, and a chi-squared cut on side 1. The Americium peak is visible as the thick line around an energy 0.002 V. It noticeably thickens as the bottom edge of the peak falls. This shows the de-neutralization of the crystal.
| Figure 8: Q-Sum vs. Time for zip 2 |
|---|
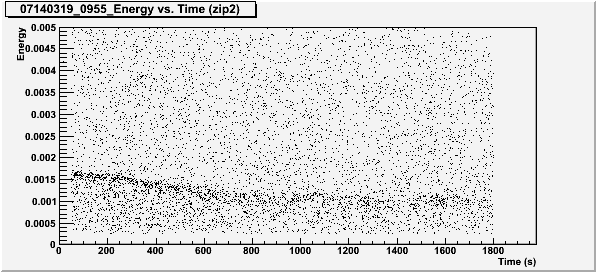 |
Figure 8 shows qSum vs. time for side 2 with a low energy cut for side 2, a charge partition cut on side 2, and a chi-squared cut on side 2. The Americium peak is visible as the slightly darker line around 0.0015 V. It clearly falls off after around 200 s (~ 3 minutes). This shows when the crystal is no longer neutral.
The Americium peak is visible on side 2 here only when side 2 is collecting electron holes. The plots of qSum vs. Time and of qSum spectra for different time lengths show that the crystal was no longer neutral after the first 5 minutes or so. This is visible in the qSum spectra of side 2, because the Americium peak is no longer visible after 5 minutes. The qSum vs. Time graph shows this through the darker region falling off to a lower energy.