−Table of Contents
Determining effect of varying the attenuation resistor
Pulse area and Maximum Histograms
The blue LED was run with increasingly strong resistors with SiPM 4 in the dark-box. Each event was externally triggered and delayed by 400 ns. Each data file contains 10k events.
| Table 1: Resistances used and the data file for each run. | ||
|---|---|---|
| Run | Resistance | Data file |
| 1 | 1.693 kOhm | 130711_sipm4_blueled_delayed-trig_1.693kohm.dat |
| 2 | 1.750 kOhm | 130711_sipm4_blueled_delayed-trig_1.750kohm.dat |
| 3 | 1.807 kOhm | 130711_sipm4_blueled_delayed-trig_1.807kohm.dat |
| 4 | 1.838 kOhm | 130711_sipm4_blueled_delayed-trig_1.838kohm.dat |
| 5 | 1.906 kOhm | 130711_sipm4_blueled_delayed-trig_1.906kohm.dat |
| 6 | 1.963 kOhm | 130711_sipm4_blueled_delayed-trig_1.963kohm.dat |
| 7 | 2.00 kOhm | 130715_sipm4_blueled_delayed-trig_2.00kohm.dat |
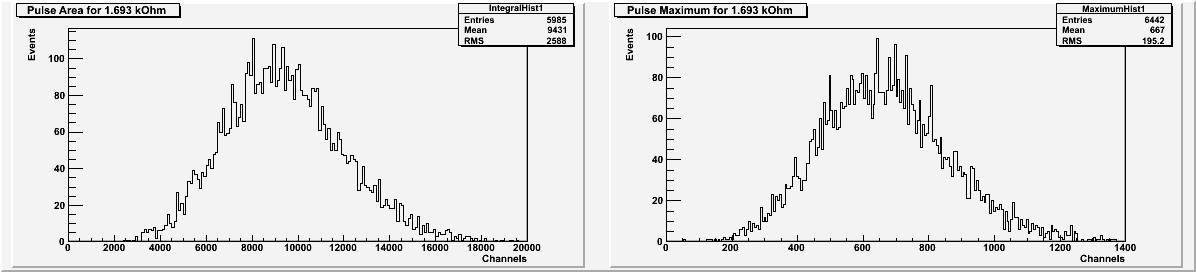
| Figure 1: Pulse area and maximum for 1.693 kOhm resistor. |
|---|
 |
| Figure 2: Pulse area and maximum for 1.750 kOhm resistor. |
|---|
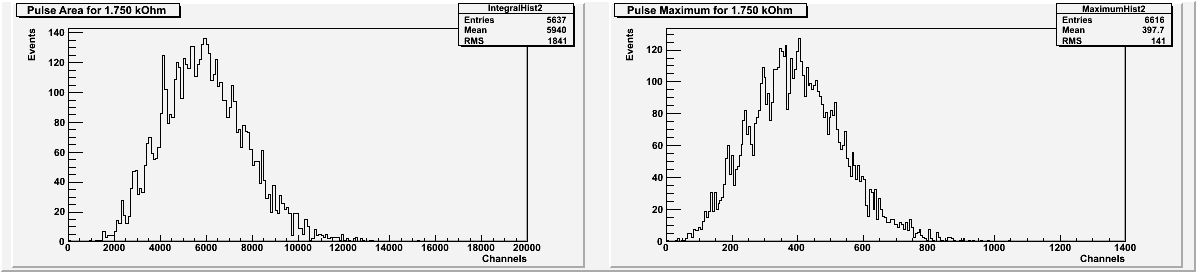 |
The photoelectron peaks are not visible enough in the first two resistances (Figures 1 and 2) for further calculations.
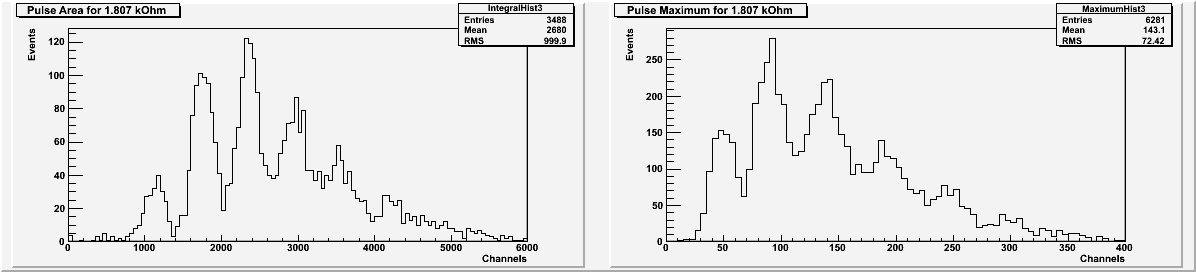
| Figure 3: Pulse area and maximum for 1.807 kOhm resistor. |
|---|
 |
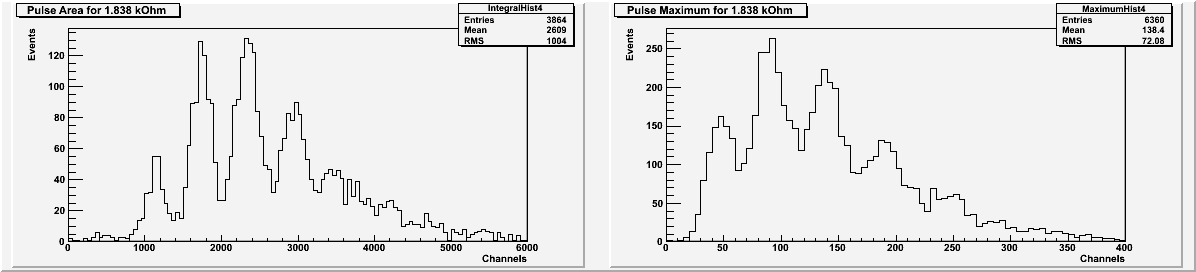
| Figure 4: Pulse area and maximum for 1.838 kOhm resistor. |
|---|
 |
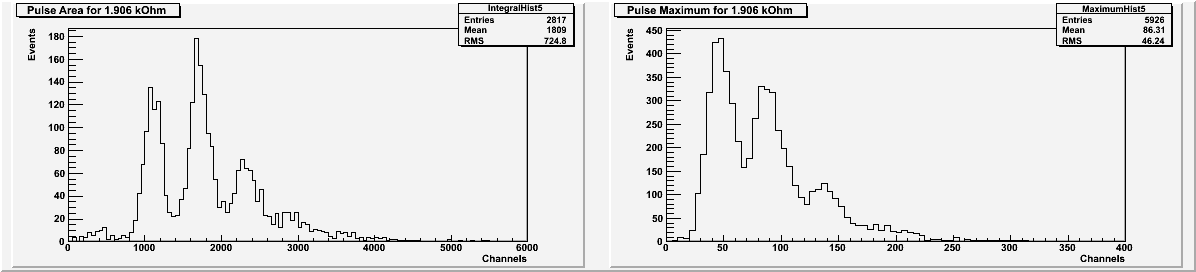
| Figure 5: Pulse area and maximum for 1.906 kOhm resistor. |
|---|
 |
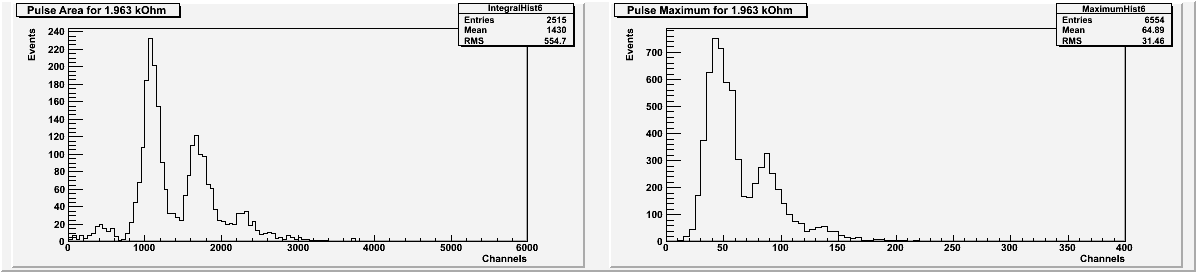
| Figure 6: Pulse area and maximum for 1.963 kOhm resistor. |
|---|
 |
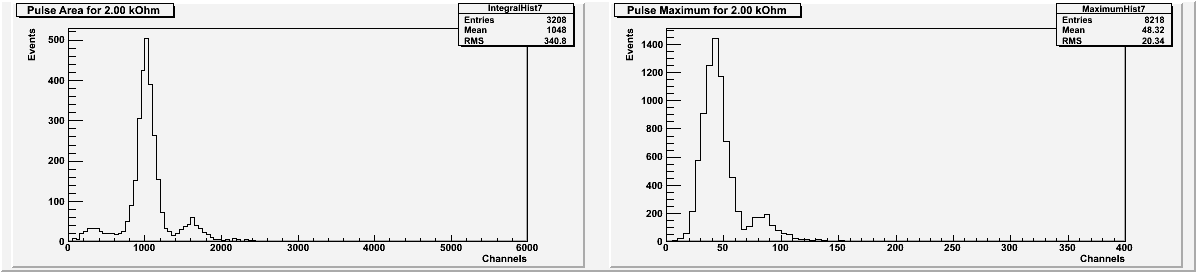
| Figure 7: Pulse area and maximum for 2.00 kOhm resistor. |
|---|
 |
| Table 2: The above histograms exclude pulses with a baseline standard deviation greater than what is listed here. | ||
|---|---|---|
| Run | Resistance | Baseline standard deviation |
| 1 | 1.693 kOhm | 23 |
| 2 | 1.750 kOhm | 23 |
| 3 | 1.807 kOhm | 22 |
| 4 | 1.838 kOhm | 23 |
| 5 | 1.906 kOhm | 22 |
| 6 | 1.963 kOhm | 23 |
| 7 | 2.00 kOhm | 23 |
All histograms of pulse area also exclude any events with a secondary pulse.
Weighted average number of photoelectrons
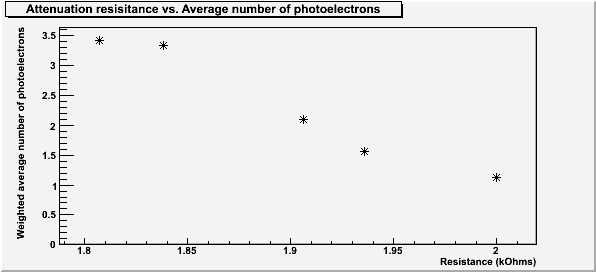
The weighted average number of photoelectrons for each attenuation resistance (excluding the two with photoelectron peaks of low visibility) was calculated a plotted against the attenuation resistance of that run. This is plotted in Figure 7.
| Table 3: Weighted average number of photoelectrons for each resistance. | |
|---|---|
| Resistance | Average number of photoelectrons |
| 1.807 kOhms | 3.41 |
| 1.838 kOhms | 3.33 |
| 1.906 kOhms | 2.10 |
| 1.963 kOhms | 1.56 |
| 2.00 kOhms | 1.12 |
| Figure 7: LED attenuation resistance vs. average number of photoelectrons. |
|---|
 |
Poisson Fitting
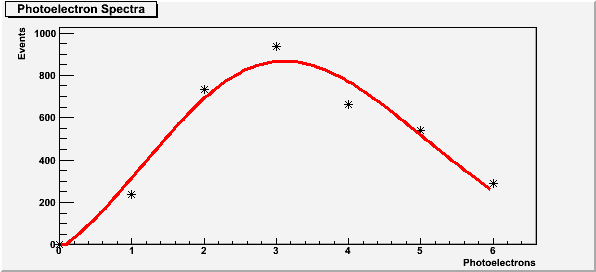
| Figure 8: Photoelectron peaks from the 1.807 kOhm resistor fit to a Poisson distribution. |
|---|
 |
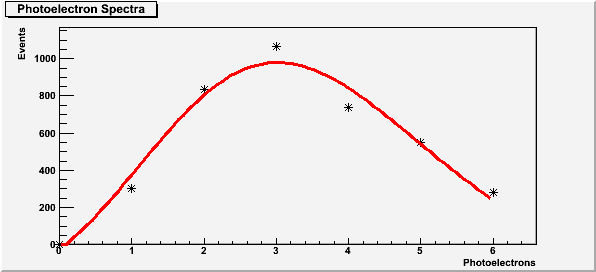
| Figure 9: Photoelectron peaks from the 1.838 kOhm resistor fit to a Poisson distribution. |
|---|
 |
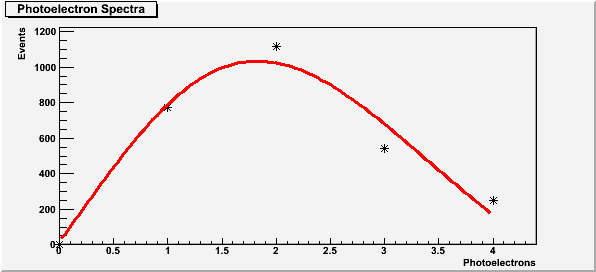
| Figure 10: Photoelectron peaks from the 1.906 kOhm resistor fit to a Poisson distribution. |
|---|
 |
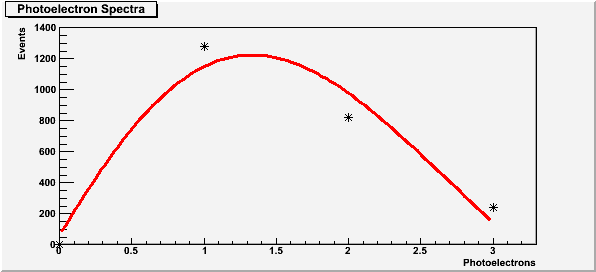
| Figure 11: Photoelectron peaks from the 1.963 kOhm resistor fit to a Poisson distribution. |
|---|
 |
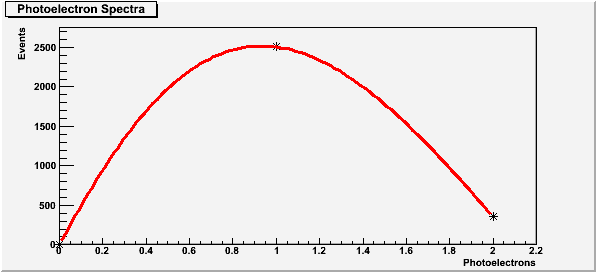
| Figure 12: Photoelectron peaks from the 2.00 kOhm resistor fit to a Poisson distribution. |
|---|
 |
| Table 4: Results of the poisson fit for each resistor. | ||
|---|---|---|
| Resistance | Average number of photoelectrons | Chi-squared |
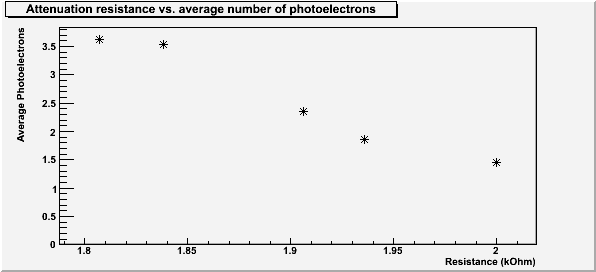
| 1.807 kOhm | 3.63 | 6670.95 |
| 1.838 kOhm | 3.53 | 6738.77 |
| 1.906 kOhm | 2.34 | 16818.8 |
| 1.963 kOhm | 1.85 | 55266.7 |
| 2.00 kOhm | 1.46 | - |
There is no chi-squared for the poisson fit of the 2.00 kOhm data because there were too few point in its graph (Figure 12).
| Figure 13: Resistance vs. Average number of photoelectrons. |
|---|
 |