SiPM 4 and the blue LED with a 1.323kOhm resistor were set up in the dark-box. Each run has 10,000 events. The signal used to flash the LED is also used to externally trigger the DAQ.
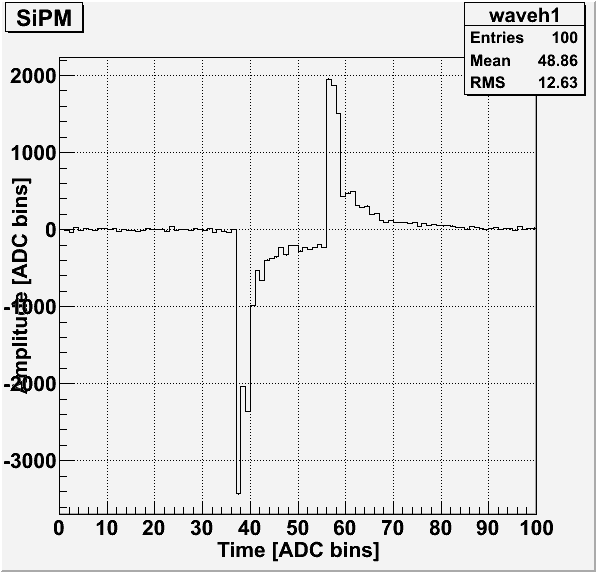
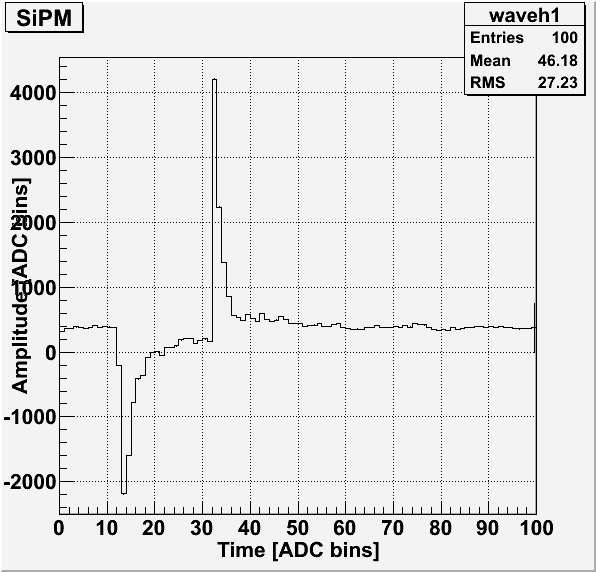
Method 1 (“Trigger on Ch1”): The LED signal is plugged into channel 1 on the DAQ. Data acquisition is triggered by channel 1. This allows the trigger pulse to be recorded. This also causes on offset as to where in the recorded data the pulse starts. This time when the pulse starts is noted as the end of the baseline.
Method 2 (“Externally triggered”); The LED signal is plugged into an external trigger port. The trigger pulse cannot be recorded.
| Table 1: Data files used to determine external trigger. |
| Trigger | Data file | notes |
| Ch 1 | 130625_blueLED_ch1-trig_10Hz_100ns_1.323kOhm.dat | Baseline is first 50 bins (usually first 30) |
| 130626_led_ch1-trig_10Hz_100ns_1.323kOhm_offset-7e8.dat | Baseline is first 25 bins (usually first 30) |
| External | 130625_blueLED_ext-trig_10Hz_100ns_1.323kOhm.dat | |
| 130626_blueLED_ext-trig_10Hz_100ns_1.323kOhm.dat | |
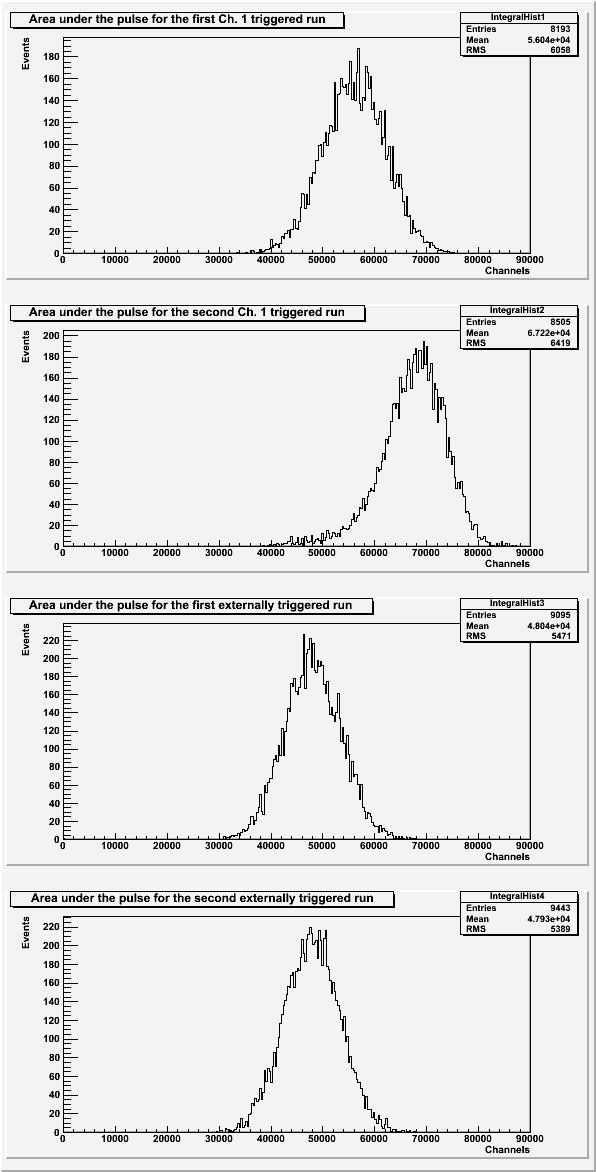
| Figure 1: The area under the pulse for each way of triggering. |
 |
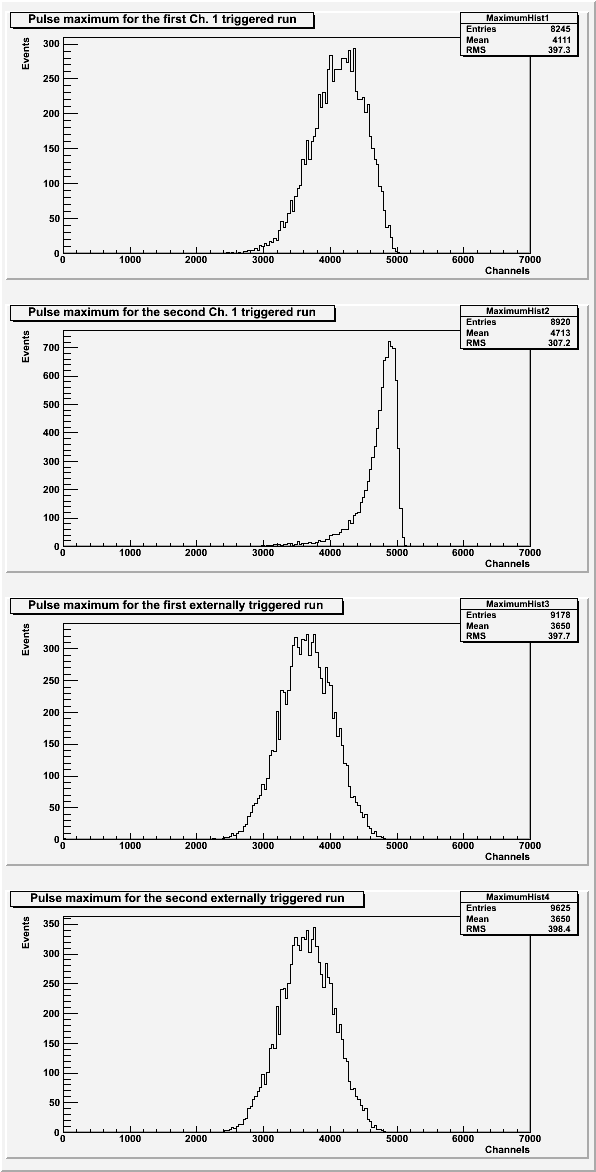
| Figure 2: The pulse maximum for each way of triggering. |
 |
| Table 2: The cuts used for each run. |
| Run | Baseline standard deviation |
| Ch. 1 (1) | 26 |
| Ch. 1 (2) | 33 |
| External (1) | 50 |
| External (2) | 52 |
The pulse area plots (Figure 1) exclude any data with more than one pulse in the integral window and any pulse with a baseline standard deviation greater than what is listed in Table 2. The pulse maximum plots (Figure 2) exclude any data with a baseline standard deviation greater than what is listed in Table 2.
The pulse maximum plot for the ch.1 trigger (Figures 2a and 2b) both seem to have a flat edge to the right side of the peak. This could mean that the SiPM was over saturated with photons. There are also no photo-electron peaks visible in the pulse area or pulse maximum plots. A larger resistor should fix both of these problems.
The external trigger is a bit easier to use even though the trigger pulse is not recorded, so later data sets will be run with the external trigger.
| Figure 3: An example of the recorded trigger pulse from the first ch. 1 triggered run. |
 |
| Figure 4: The light pulse associated with the above trigger. |
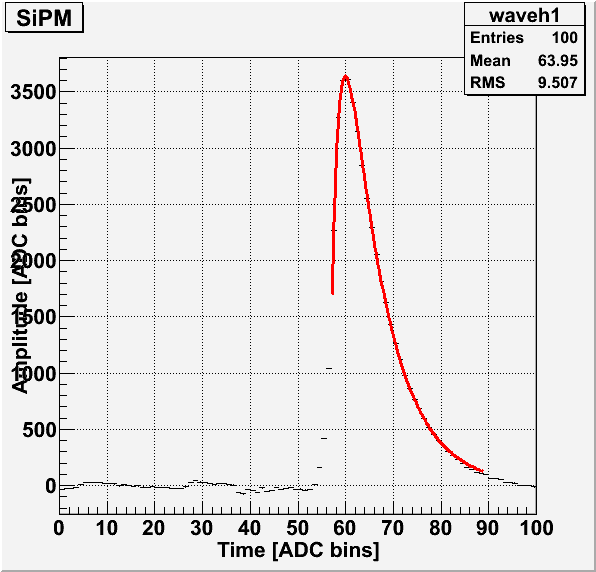 |
The tail of the pulse for the first ch. 1 triggered run (Figure 4) is not being fully recorded.
| Figure 5: An example of the recorded trigger pulse from the second ch. 1 triggered run. |
 |
| Figure 6: The light pulse associated with the above trigger. |
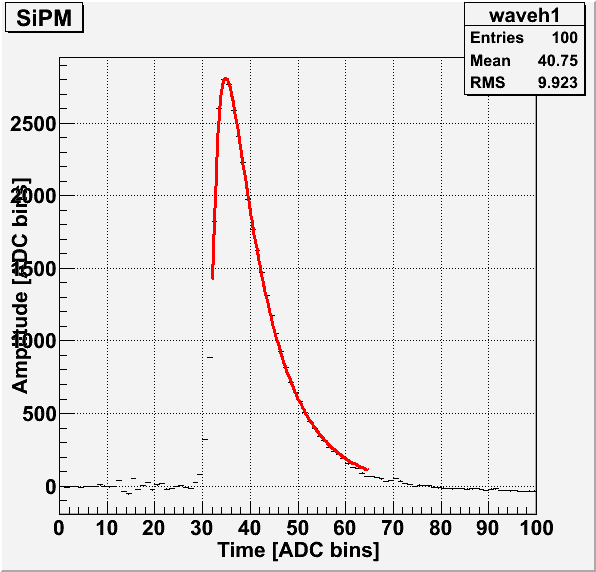 |
The start of the pulse for the second ch. 1 triggered run (Figure 6) is starting with the baseline region (the first 30 bins).