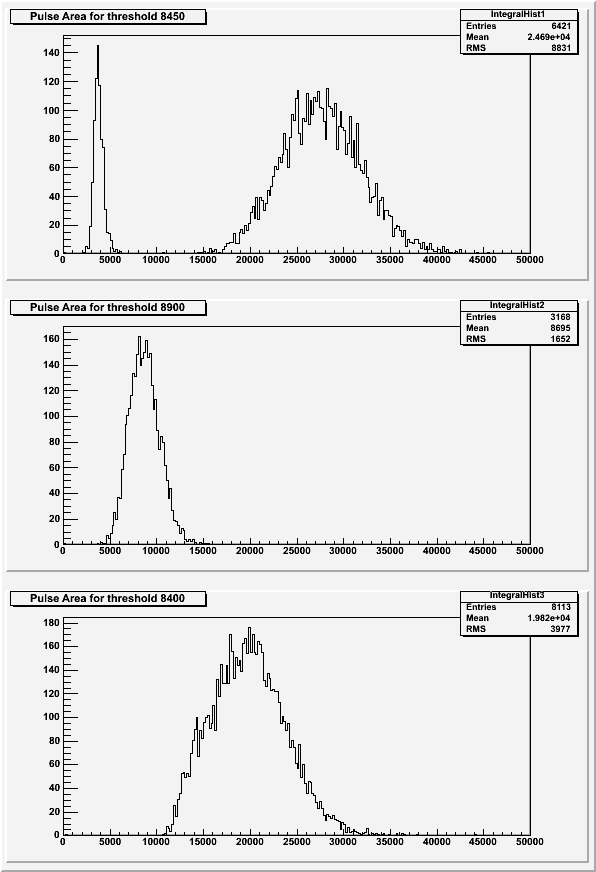
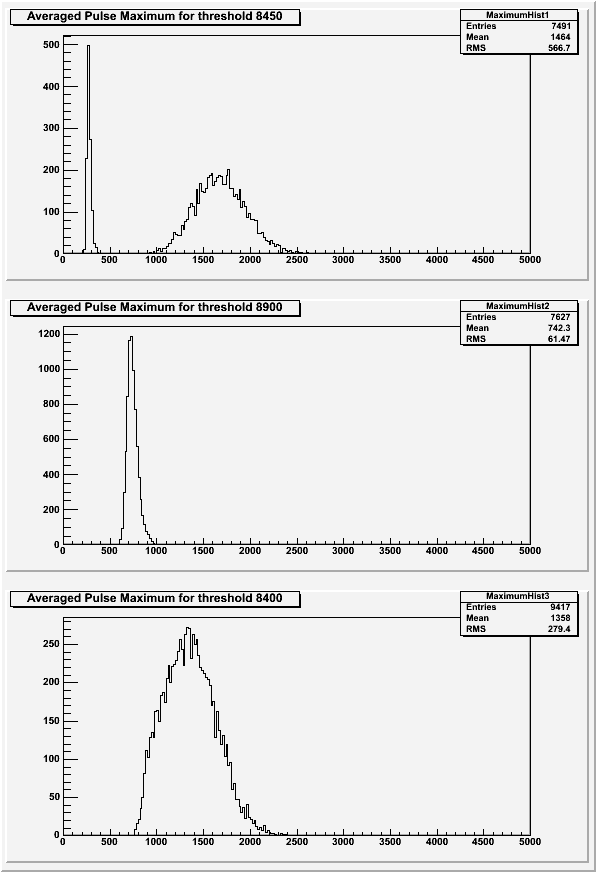
Each run used a yellow LED with a 80 Ohm resistor and SiPM 4 in the dark-box. The pulses were self-triggering with varying trigger thresholds.The self-triggering threshold was changed because two unrelated peaks were visible in the pulse area and pulse maximum histograms (visible in Figures 1a and 2a).
| Table 1: Self-triggering threshold levels. |
| Threshold | Data File |
| 8450 | 130617_yellowledtest_1.dat |
| 8900 | 130618_yellowledtest3_100ns-10Hz.dat |
| 8400 | 130619_yellowledtest_1_thesh8400.dat |
| Figure 1: Area under the pulse for each threshold level. |
 |
| Figure 2: Pulse maximum for each threshold level. |
 |
| Table 1: The histograms in Figures 1 and 2 use the following cuts: |
| Threshold | Baseline Standard Deviation |
| 8450 | 17 |
| 8900 | 55 |
| 8400 | 50 |
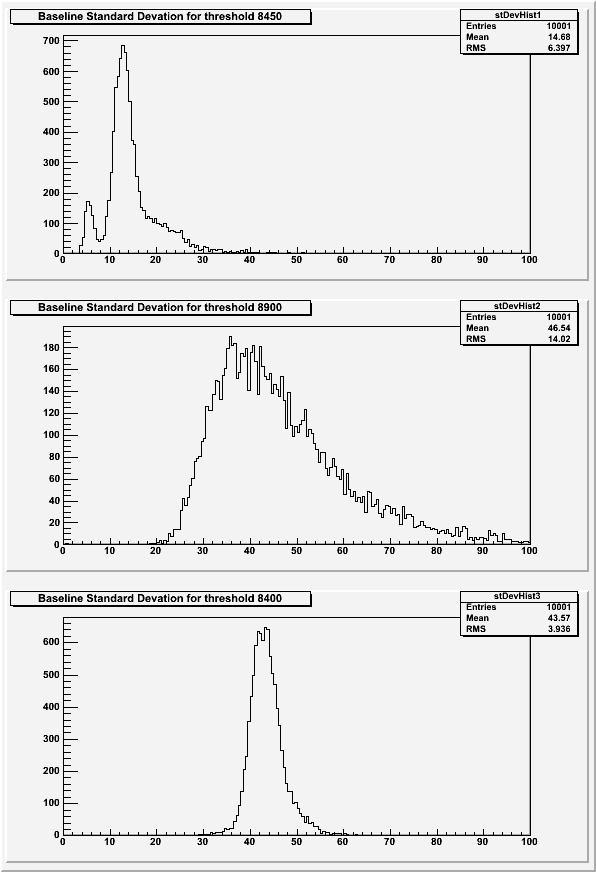
The histograms for area under the pulse and pulse maximum for threshold 8450 show two peaks. The first peaks corresponds to a baseline standard deviation less than 7 and a chi-squared less than 2000, and the second peak to a baseline of less than 17 and a chi-squared greater than 2000 (up to around 10000). The thought was that one of these peaks was due to the SiPM self-triggering on noise, so the threshold was raised. Raising the threshold seems to have removed the second peak, while lowering the threshold seems to have removed the first peak. In the end, it was decided that for self-triggering, a higher threshold was necessary.
| Figure 3: Baseline standard deviations for each threshold level. |
 |
| Figure 4: Chi-squared for each threshold level. |
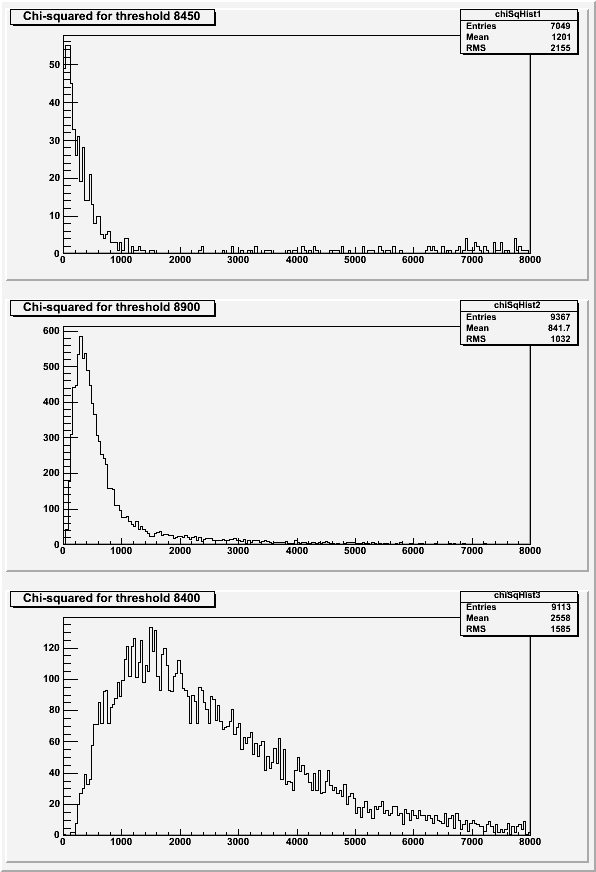 |
For the histogram of the chi-squared of the fit (Figure 4), events for which the fit failed are not included.