Americium Run with ~ 13 mm Sample
A smaller sized scintillator sample was machined to about 10 mm thick. This sample was tested with background and Am-241 in the new dark room with PMT R1332. The full-scale used was 0.8V.
| Table 1: Run Information |
| Run | Source | Threshold | Bias Voltage | Number Events | Total Time | Saturation | Data File |
| 1 | background | 30 mV | 1800 V | 10002 | 2869 s | 13.47% | 20140728_R1332_1800V_background2.dat |
| 2 | Am-241 | 30 mV | 1800 V | 13439 | 333 s | 0.156% | 20140728_R1332_1800V_am241.dat |
| 3 | background | 30 mV | 2000 V | 10015 | 925 s | 6.67% | 20140729_R1332_2000V_background.dat |
| 4 | Am-241 | 30 mV | 2000 V | 10255 | 227 s | 0.897% | 20140729_R1332_2000V_am241.dat |
| 5 | Am-241 | 30 mV | 2200 V | 10001 | 214 s | 2.190% | 20140729_R1332_2200V_am241.dat |
| 6 | background | 90 mV | 2200 V | 9998 | 627 s | 3.901% | 20140729_R1332_2200V_background_90mV-threshold.dat |
| 7 | Am-241 | 90 mV | 2200 V | 10005 | 229 s | 2.009% | 20140729_R1332_2200V_am241_90mV-threshold.dat |
| 8 | Am-241 | 90 mV | 2200 V | 187843 | 3965 s | 0.5212% | 20140730_R1332_2200V_am241_90mV-threshold.dat |
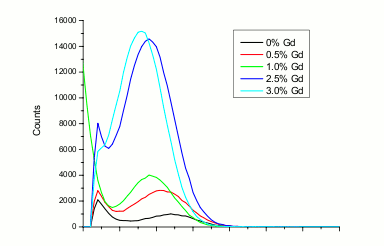
| Figure 1: Example Am-241 Histogram from Ovechkina (2009). |
 |
1800V Bias
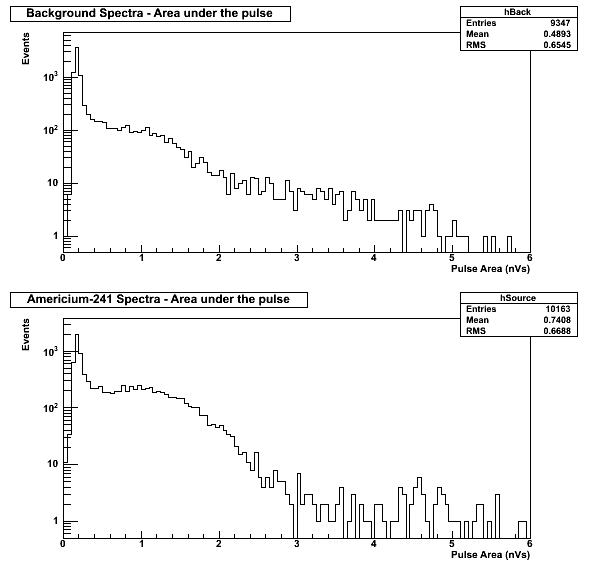
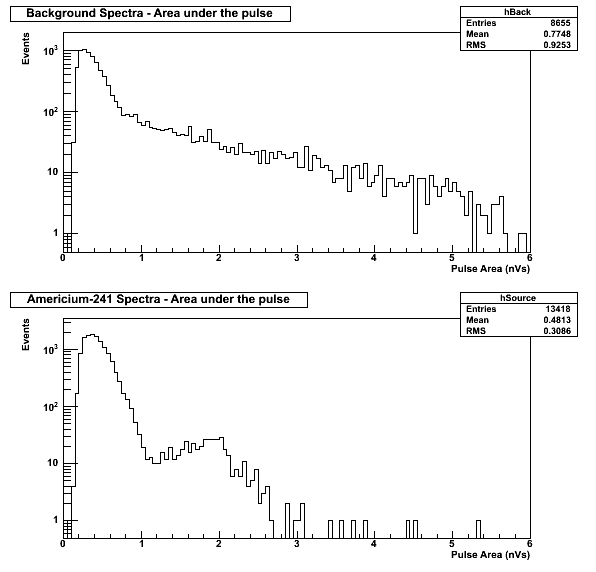
| Figure 2: Pulse Area Spectra for Both Runs at 1800V |
 |
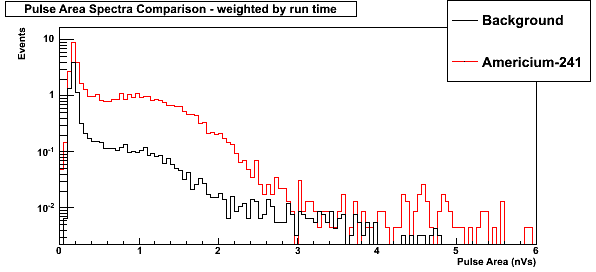
| Figure 3: Pulse Area Comparison weighted by run time (at 1800V) |
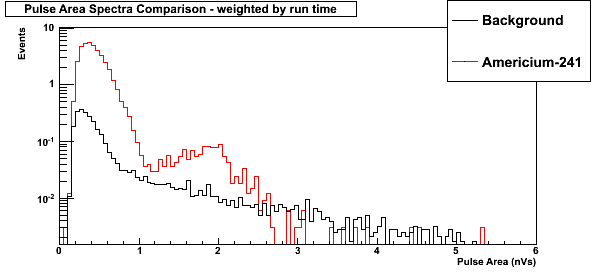 |
Comparing the background spectra to the Americium-241 spectra, it appears that perhaps the Compton continuum and peak are visible. The Am-241 peak would be around 2 nVs, and the Compton continuum would sit right on top of the background.
2000V Bias
2200V Bias
| Figure 8: Comparison of Americium-241 pulse area spectra for all voltage biases. |
 |
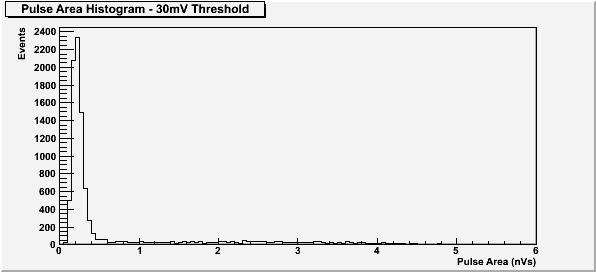
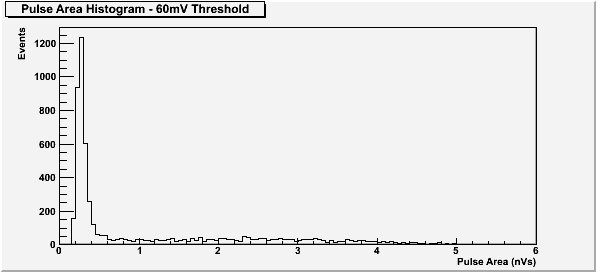
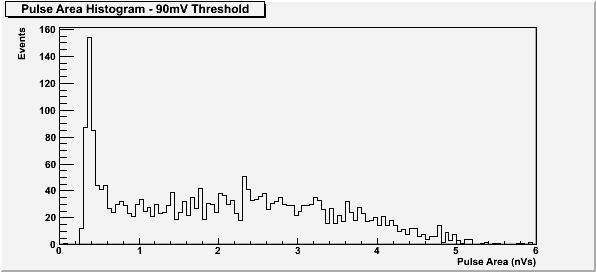
| Figure 9: Comparison of Artificially Imposed Thresholds. |
 |
 |
 |
Higher Threshold at 2200 V
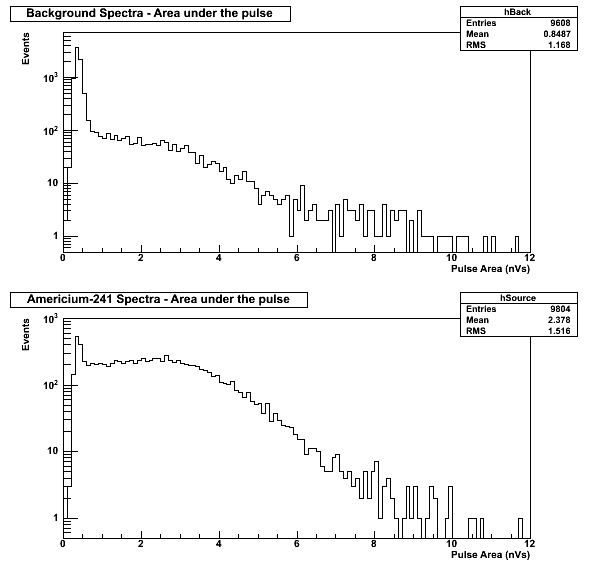
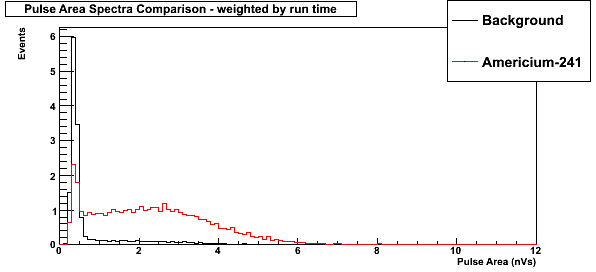
The 2200 V bias runs were rerun with a higher threshold of 90 mV and double fullscale.
| Figure 10: Pulse Area Spectra for Both Runs at 2200V with 90 mV threshold |
 |
| Figure 11: Pulse Area Comparison weighted by run time (at 2200V and 90 mV threshold) |
 |
| Figure 12: Comparison between the two runs at 2200V bias |
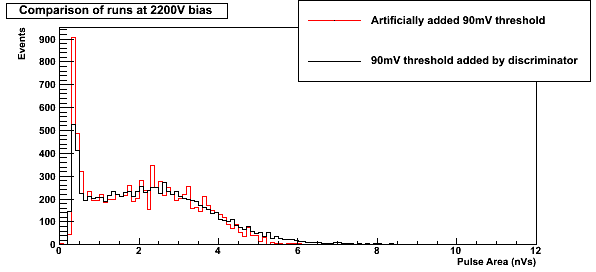 |
The run with the “artificially” set threshold of 90mV (run 5) has been scaled to match run 7. The scale factor was calculated by the area under the curve between 1.0 nVs and 4.5 nVs (the range of the energy peak) and is about 3.76.
Long Run at 2200 V
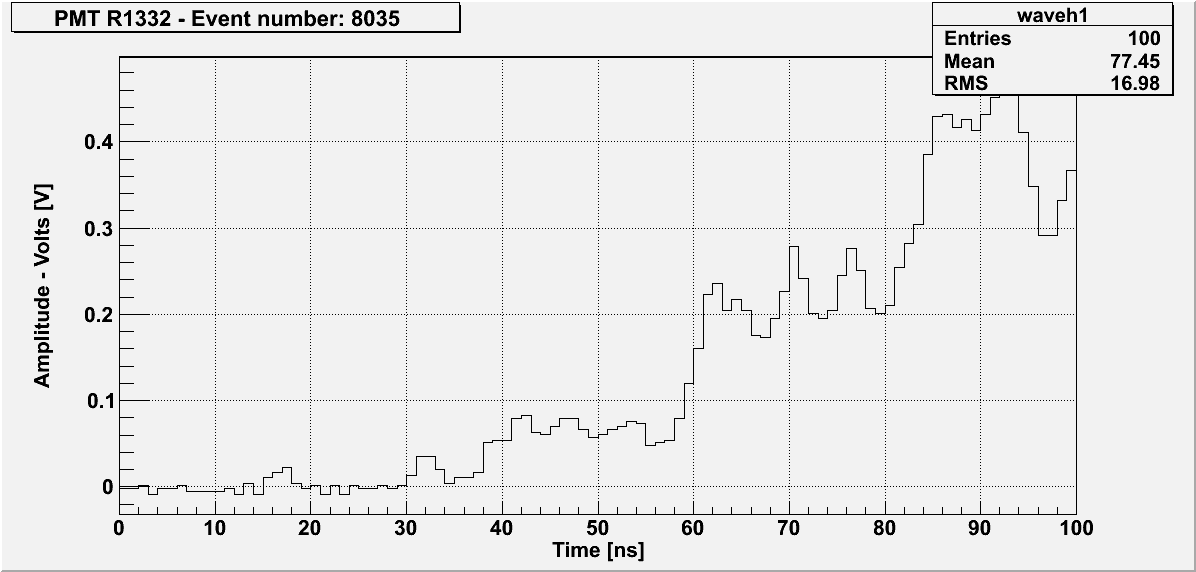
The long run at 2200 V had a discriminator set threshold of 90 mV; however, this didn't seem to work, as many good events below threshold were recorded as well. Table 2 shows the events cut by an “artificially” added threshold in the analysis.
| Table 2: Events cut by the “artificially” added threshold |
| imposed threshold | Number of events | Number of events cut | Number of events cut in energy peak |
| 0 mV | 186864 | 0 | 0 |
| 30 mV | 186863 | 1 | 0 |
| 60 mV | 187849 | 15 | 0 |
| 70 mV | 186660 | 204 | 0 |
| 80 mV | 181864 | 5000 | 0 |
| 90 mV | 164472 | 22392 | 0 |
| 100 mV | 123889 | 62975 | 1 |
| 110 mV | 91220 | 95644 | 3 |
| 120 mV | 66064 | 120800 | 20 |
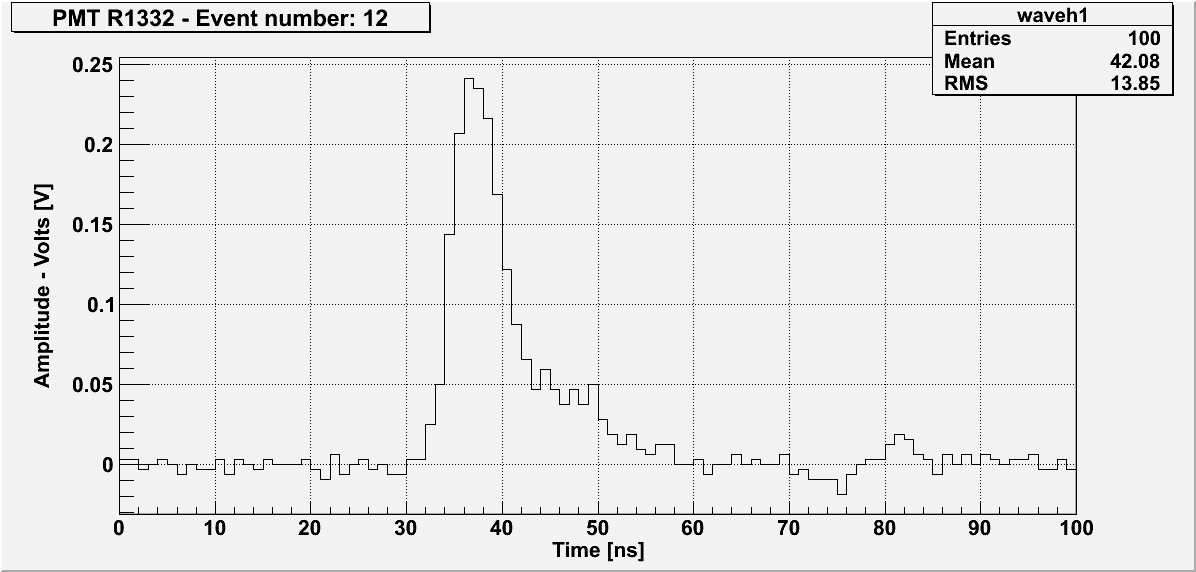
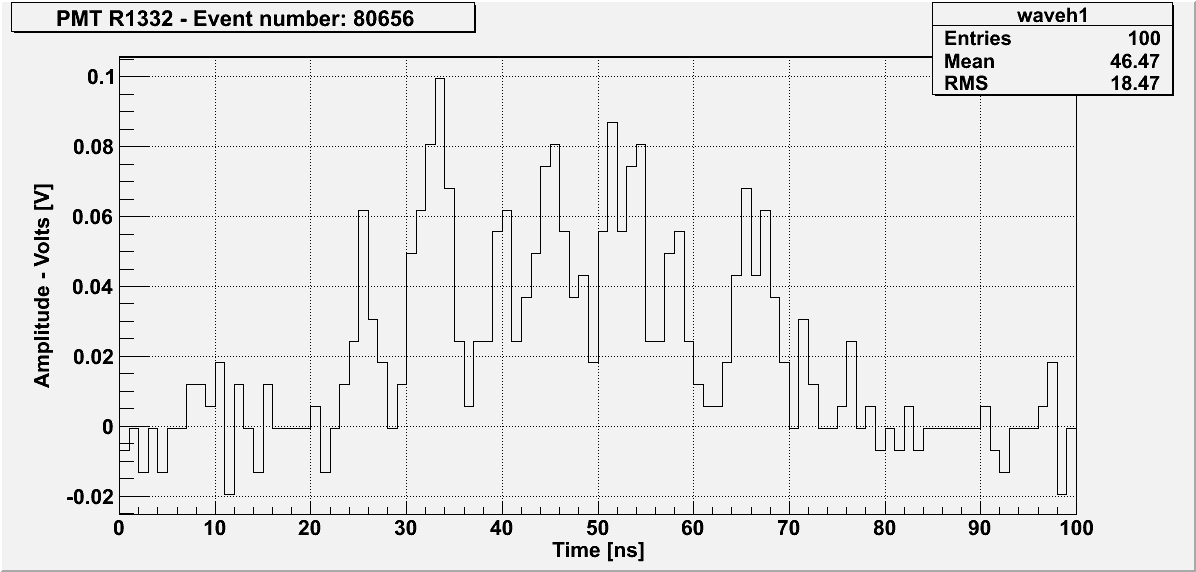
The pulses within the energy peak are defined by having a peak area greater than 1.5 nVs.
| Figure 13: Example of pulse cut by imposed threshold in energy peak. |
 |
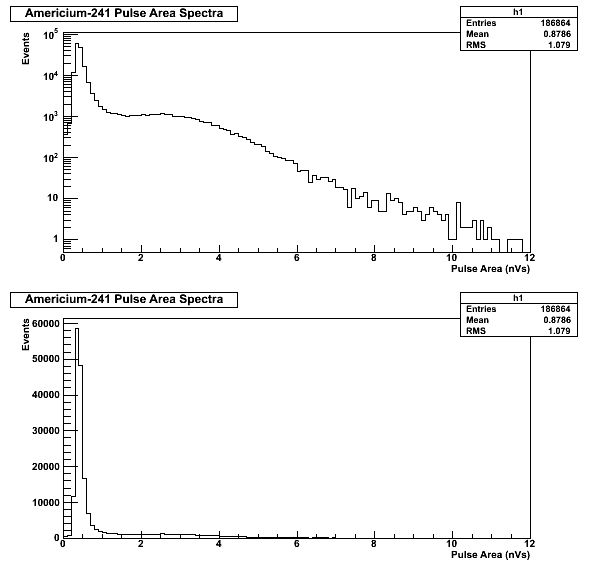
| Figure 14: Americium-241 spectra at 2200 V with a 90mV threshold |
 |
| Figure 15: Comparison of Americium-241 runs at 2200 V |
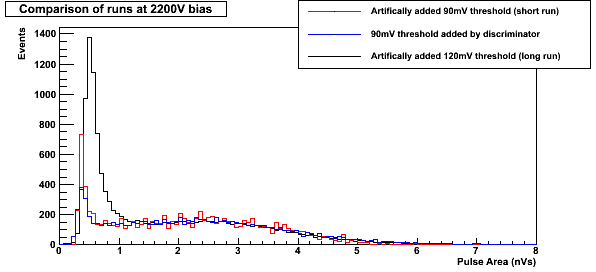 |
The run with the “artificially” set thresholds of 90mV (run 5) and 120 mV (run 8) have been scaled to match run 7. The scale factor was calculated by the area under the curve between 1.5 nVs and 4.5 nVs (the range of the energy peak past the noise).