Quantum Efficiency adjusted Emmission Spectra
The following plots were created by multiplying the power at each wavelength to the quantum efficiency of the PMT at that wavelength
| QE x Power for DMR 15A (unloaded) | QE x Power for DMR 15C 0.055% wt Gd (Gd(i-Pr)3) |
|---|---|
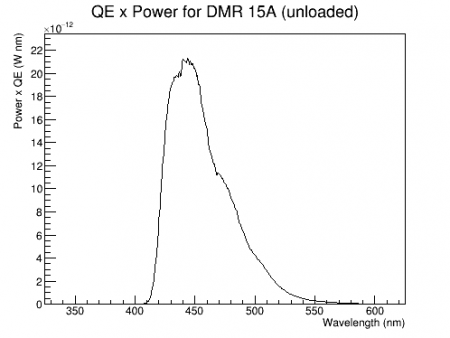 | 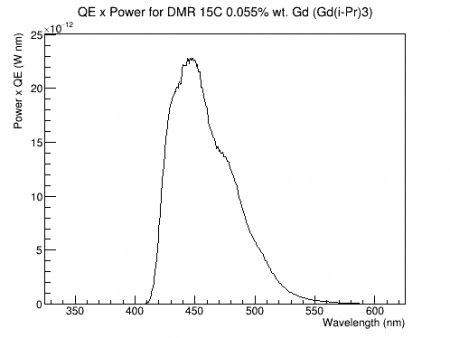 |
| QE x Power for DMR 15D 0.055% wt Gd (Gd(TMHD)3) | QE x Power for WLS Fiber |
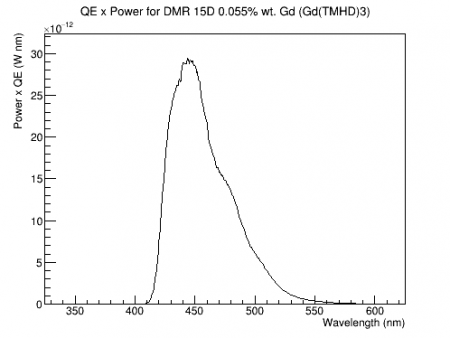 | 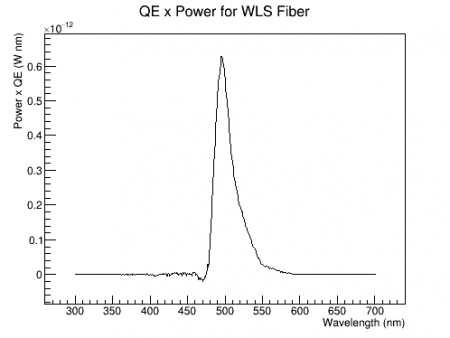 |
Area under the curves and Ratios
Area under each of these graphs was calculated by point-by-point integration and ratios for the area under the curve for each of the scintillators as a fraction of the area under the curve for the WLS fiber was also calculated
| Sample | Area under curve | Fraction : (Sample/ WLS ) |
|---|---|---|
| WLS Fiber | 1.95E-11 | |
| DMR 15 A (unloaded) | 1.19E-9 | 61.15 |
| DMR 15 C 0.055% wt Gd (Gd(i-Pr)3) | 1.37E-9 | 70.27 |
| DMR 15 D 0.055% wt Gd (Gd(TMHD)3) | 1.62E-9 | 83.04 |