Power spectrum of LEDs with known peak emission wavelengths
Four different LEDs are measured using the Oriel 74000 monochromator. Each LED is aligned such that the monochromator slit is inside the viewing angle of the LED. The LED model numbers are given in table 1.
| Table 1: Expected & Observed Peaks | ||||
|---|---|---|---|---|
| Color | Model # | Expected Peak (nm) | Observed Peak (nm) | Difference (nm) |
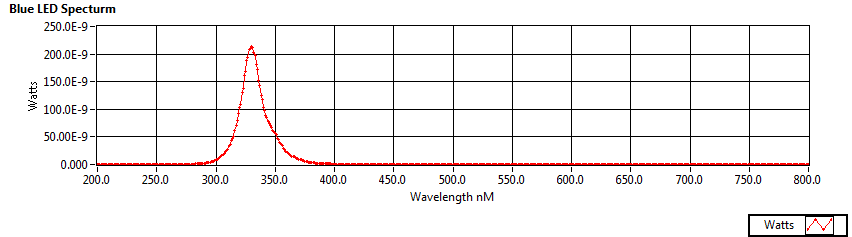
| Blue | 638-333-2SUBC470 | 470 | 330 | +140 |
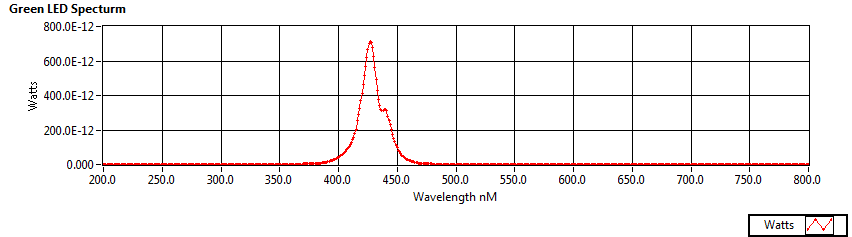
| Green | 638-MV8412 | 565 | 427 | +138 |
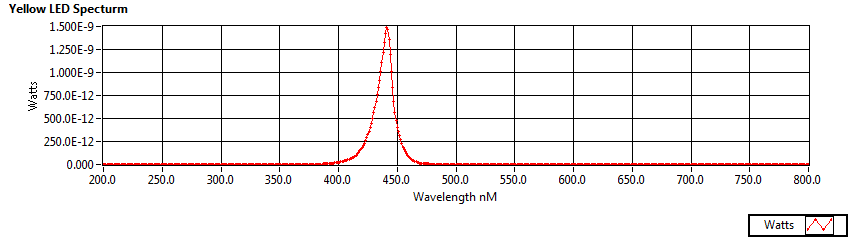
| Yellow | 638-MC8304 | 590 | 441 | +149 |
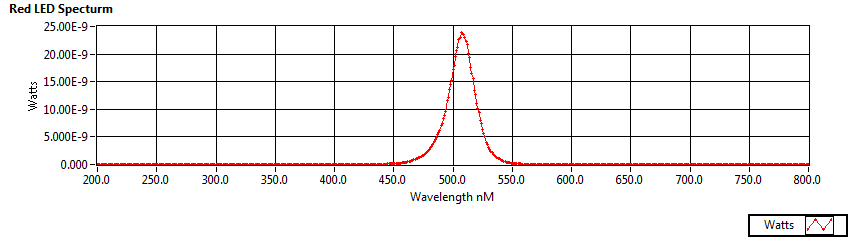
| Red | 638-MV8104 | 660 | 507 | +153 |
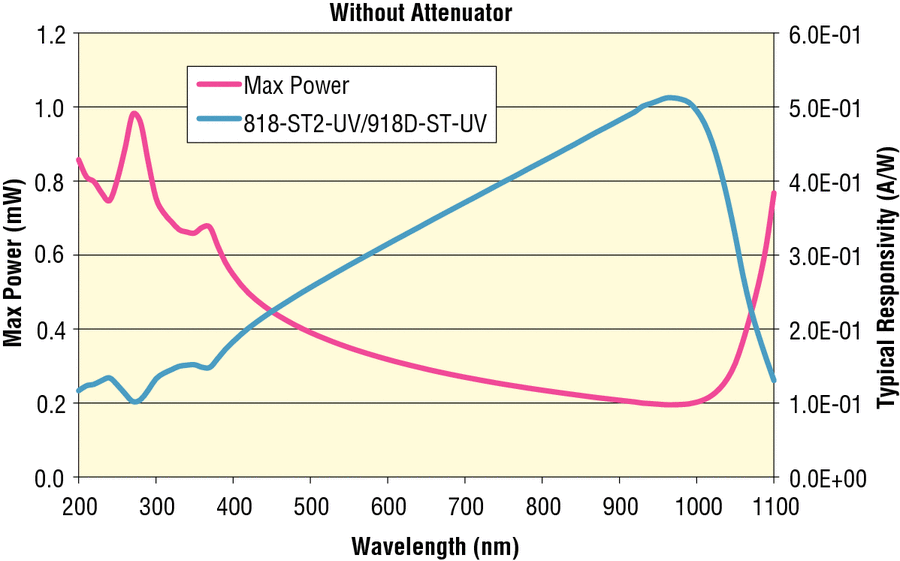
Each LED appears to have a peak emission wavelength 140-150 nm lower than the manufacturer rating. These results would put the blue LED entirely in the UV spectrum, yet the blue LED has a bright blue color when illuminated. The power spectrum for each LED is calculated using the responsivity curve given in figure 5.
| Figure 1: Blue LED power spectrum |
|---|
 |
| Figure 2: Green LED power spectrum |
|---|
 |
| Figure 3: Yellow LED power spectrum |
|---|
 |
| Figure 4: Red LED power spectrum |
|---|
 |
Newport Photodiode Responsivity
| Figure 5: Responsivity curve (in blue) for 818-ST2-UV/DB |
|---|
 |