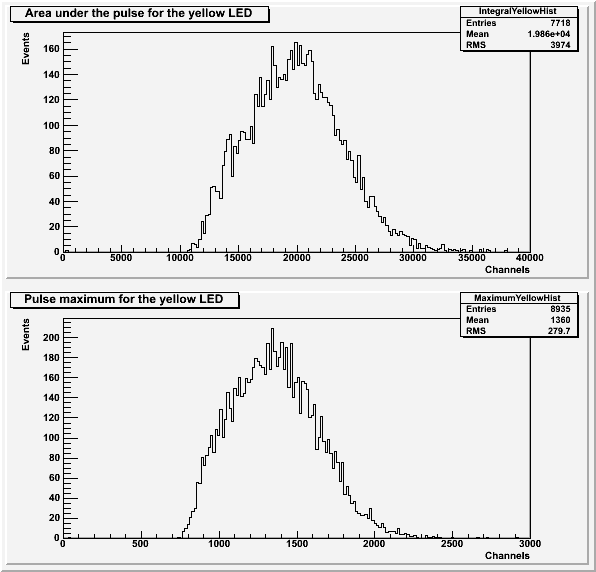
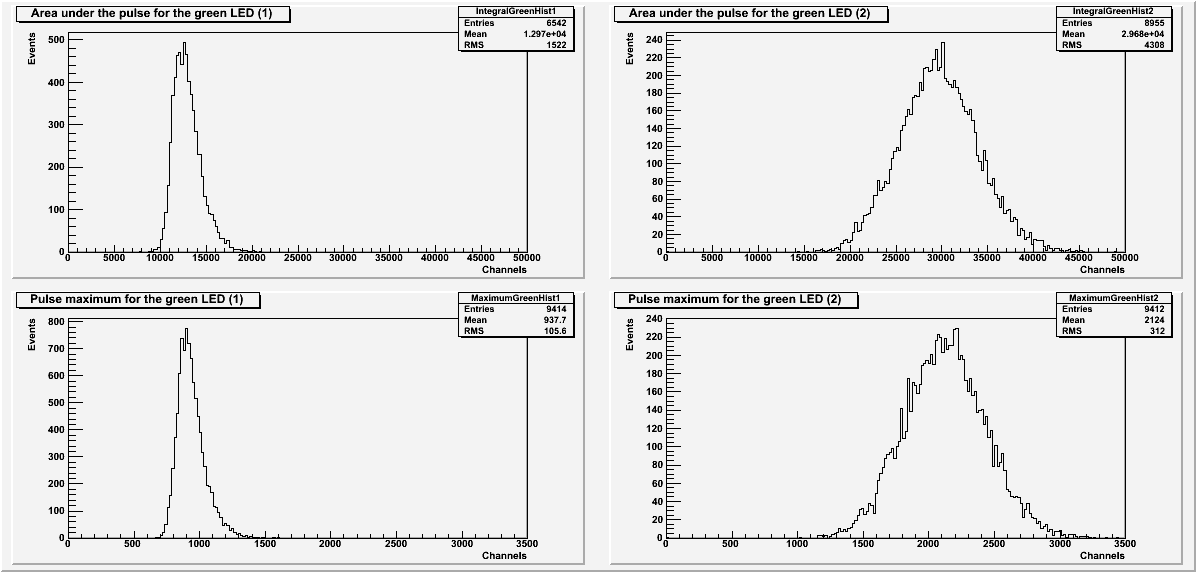
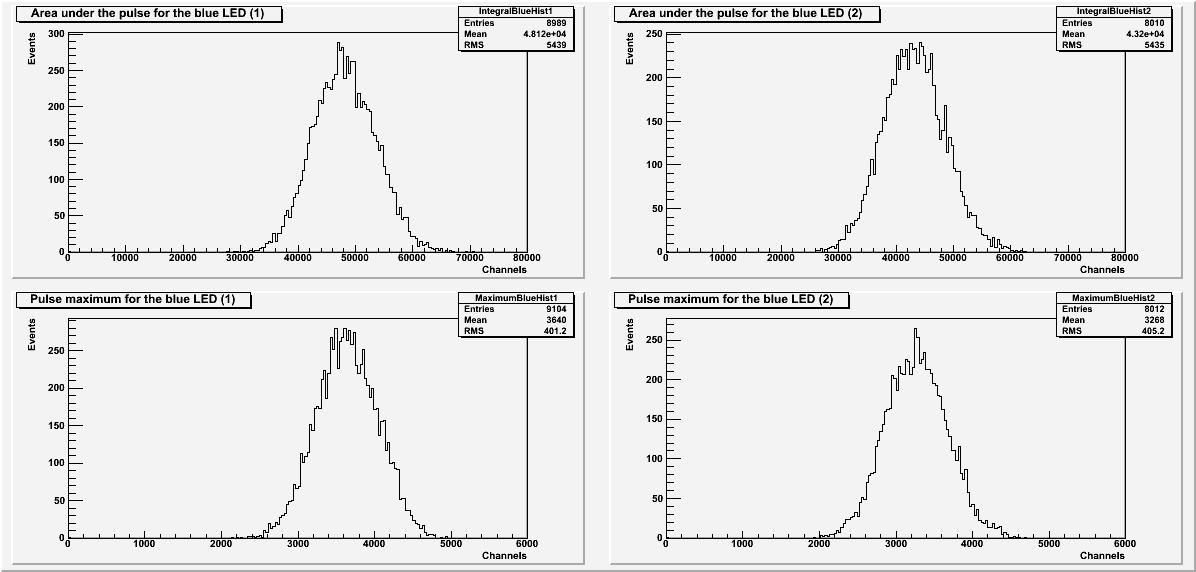
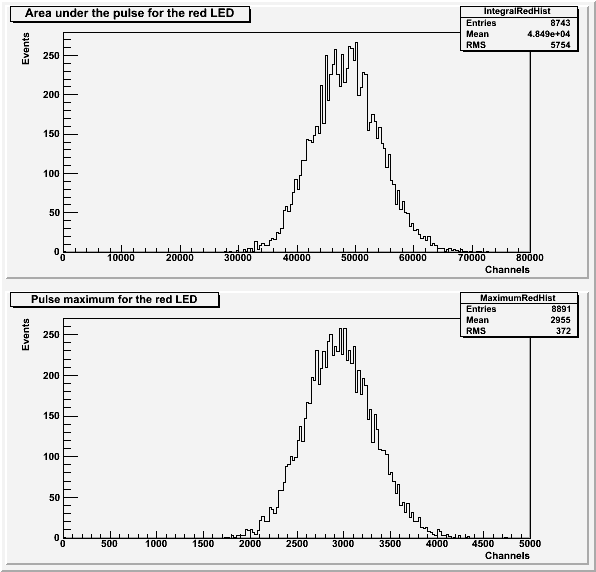
The LED color was changed between yellow, green, blue, and red to see if the color changed the pulse area and maximum peaks. The resister was changed for each LED color to try to keep the LED intensity relatively similar. The self-triggered threshold was kept at 9000, and SiPM 4 was used for each run.
| Table 1: Resistors used for each color. |
| LED Color | Resistor | Data File |
| yellow | 4.68 kOhms | 130619_yellowLED_threshold9000_10Hz_100ns_4.68kOhm.dat |
| green | 3.88 kOhms | 130619_greenLED_threshold9000_10Hz_100ns_3.88kOhm.dat |
| 3.42 kOhms | 130620_greenLED_threshold9000_10Hz_100ns_3.42kOhm.dat |
| blue | 1.66 kOhms | 130620_blueLED_threshold9000_10Hz_100ns_1.66kOhm.dat |
| 1.328 kOhms | 130621_blueLED_threshold9000_10Hz_100ns_1.328kOhm.dat |
| red | 4.68 kOhms | 130620_redLED_threshold9000_10Hz_100ns_4.68kOhm.dat |
| Figure 1: Yellow LED. |
 |
| Figure 2: Green LED. |
 |
| Figure 3: Blue LED. |
 |
| Figure 4: Red LED. |
 |
| Table 2: Cuts used in making the above histograms. |
| LED | Baseline standard deviation |
| Yellow | 48 |
| Green (1) | 48 |
| Green (2) | 55 |
| Blue (1) | 49 |
| Blue (2) | 28 |
| Red | 45 |
Each histogram of the area under the pulse also used a cut to remove extra pulses before and after the main pulse.
Because no peaks are visible in any of these plots and the resistance changes between LED colors, there's not much that can be done with this data. The conclusion of all of this is that a higher resistance (lower LED intensity) would be needed to resolve the photoelectron peaks.