Initial Code Optimization
Data taken on 2013/07/15 using SiPM 4 in the dark-box with no light source (file name: 130517_sipm4_greentest_1.dat). This initial data was used to improve the code in three ways: determining at which bin the fit of the pulse should begin, which method should be used to calculate the averaged value of the maximum bin, and which method should be used to calculate the integral of the pulse. Each pulse was fit to a double exponential function.
| Figure 1: Chi-squared comparison of the methods used in determining the starting bin of the peak. |
|---|
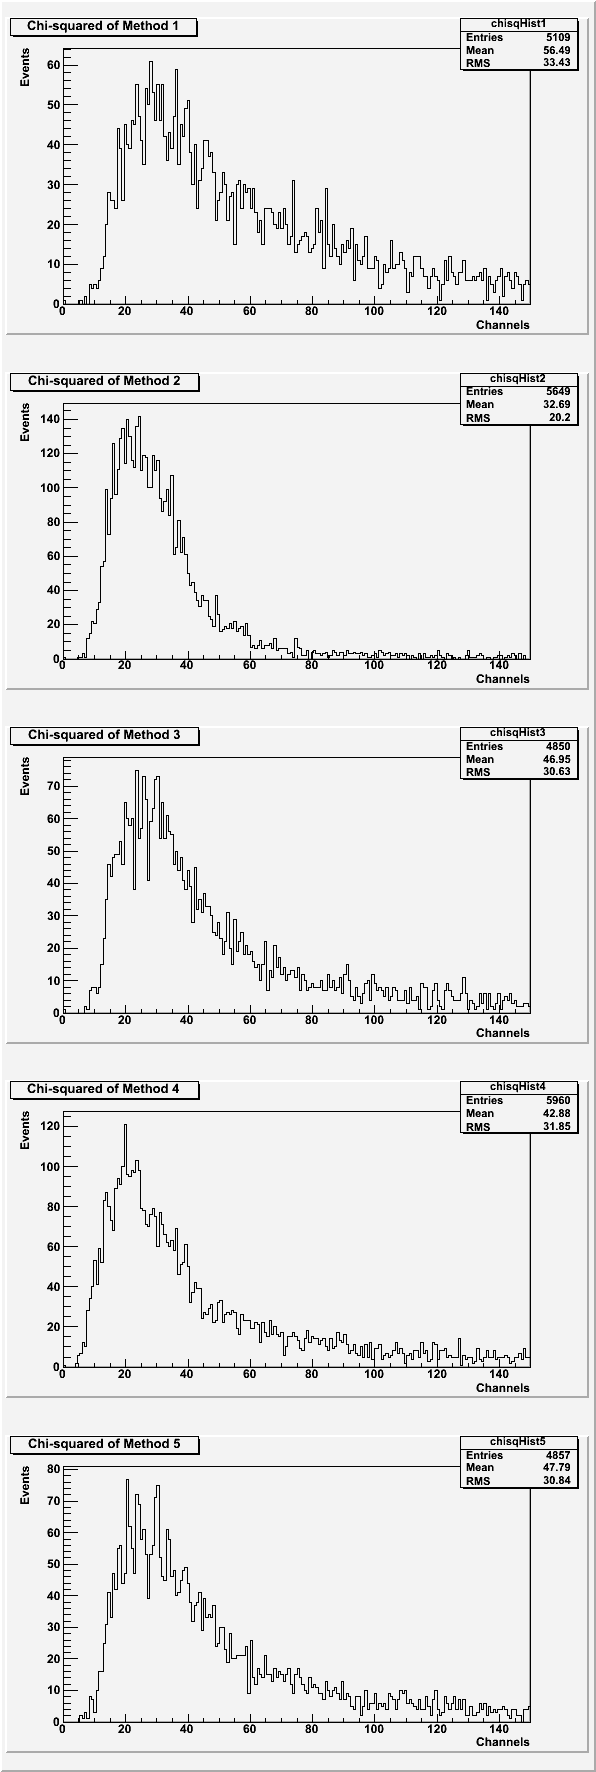 |
Method 1: The fit starts two bins before the bin with the peak maximum.
Method 2: The fit starts three bins before the bin with the peak maximum.
Method 3: The fit starts at the bin that is at 50% of the peak maximum.
Method 4: The fit starts at the bin that is at 40% of the peak maximum.
Method 5: The fit starts at the bin that is at 10% of the peak maximum.
Even though Method 2 gives the lowest chi-squared, Method 4 was chosen as the best starting bin. The variable binning option allows the peak shape to vary while maintaining a good fit. Method 4 has the lowest chi-squared of the variable bin options. Events with a background (first 30 bins) standard deviation greater than 7 were not considered. Events for which the fit failed were also excluded in the above histograms.
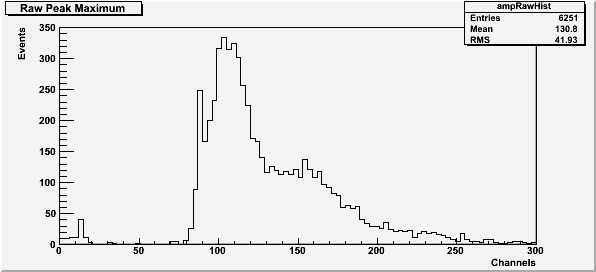
| Figure 2: The maximum of the peak |
|---|
 |
| Figure 3: Comparison of different methods of determining the averaged value of the peak maximum. |
|---|
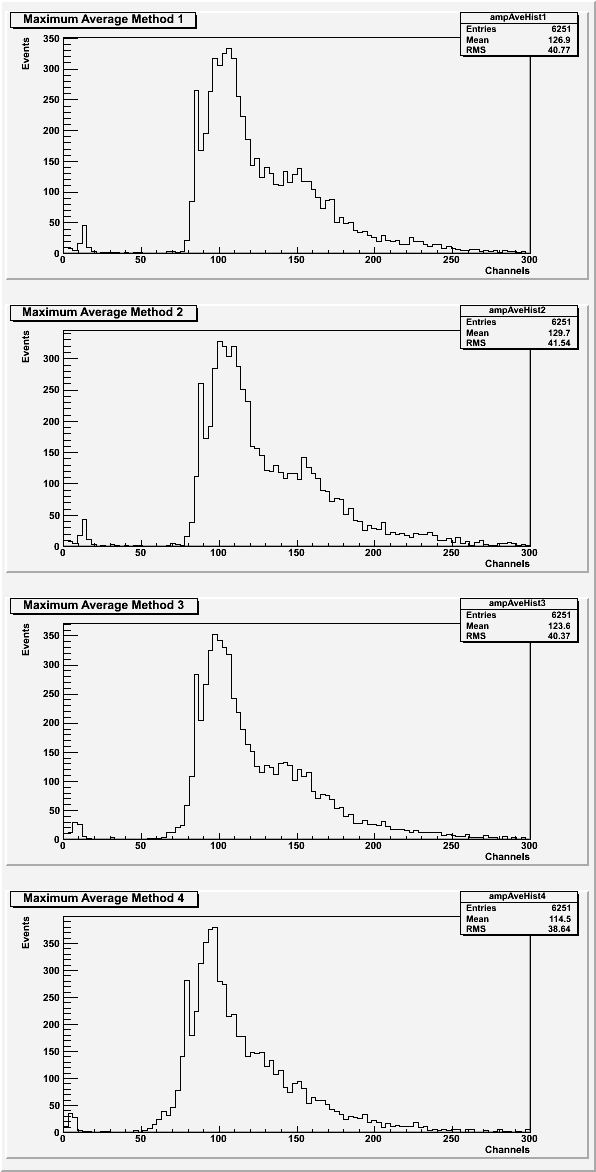 |
Method 1: Average together any bins near the maximum bin that is at least 90% of the maximum.
Method 2: Average together any bins near the maximum bin that is at least 95% of the maximum.
Method 3: Average together the maximum bin and one bin on either side.
Method 4: Average together the maximum bin and two bins on either side.
The histograms of the raw maximum and the averaged maximums do not consider data with a background standard deviation greater than 7. There appears to be no difference between averaging methods and the raw maximums. The averaging method chosen was method 3, because it is the fastest of the four methods.
| Figure 4: Comparison of different methods to find the area under the pulse. |
|---|
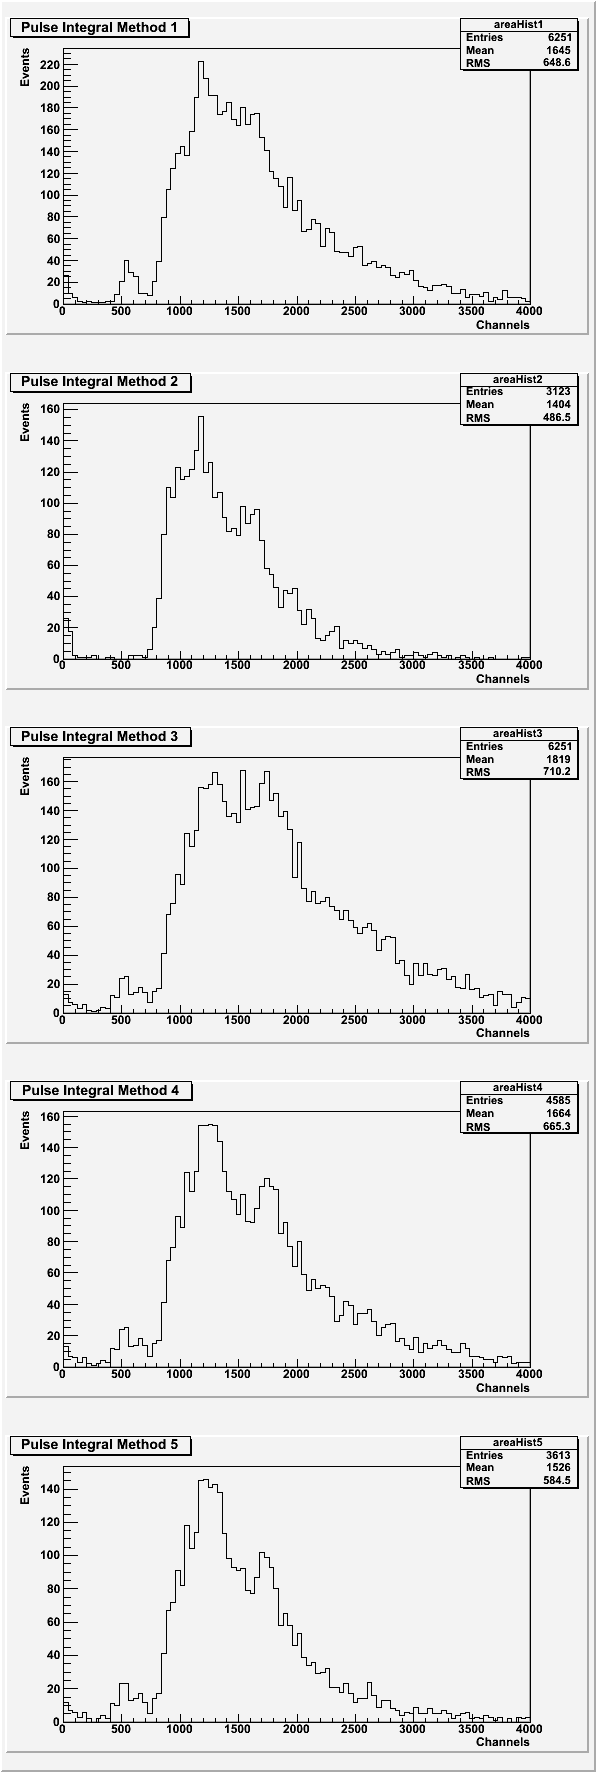 |
Method 1: Integrate each pulse from the start bin to 20 bins past the maximum bin. Pulses with a background standard deviation greater than 7 are cut.
Method 2: Integrate the double exponential function from the fit from the start bin to 20 bins past the maximum bin. Pulses with a background standard deviation greater than 7 or a chi-squared greater than 80 are cut.
Method 3: Integrate each pulse from bin 30 (the end of background) to bin 70. Pulses with a background standard deviation greater than 7 are cut.
Method 4: Integrate each pulse from bin 30 to bin 70. Pulses with a background standard deviation greater than 7 or having a second pulse before the main pulse within the 30-70 bin range are cut.
Method 5: Integrate each pulse from bin 30 to bin 70. Pulses with a background standard deviation greater than 7 or having a second pulse before or after the main pulse within the 30-70 bin range are cut.
Method 5 was chosen as the best option. It gives the best histogram (possibly two photoelectron peaks can be seen), and it eliminates pulses contaminated by more photons hitting (or darkcount on) the SiPM.