Determining the Darkcount Rate
SiPM 4 was placed in the dark-box with no light source. Each event was self-triggered with a threshold of 8250 for a total of 10k events. The data file for this run is 130711_sipm4_darkcount.dat.
| Figure 1: Area under the pulse and pulse maximum. |
|---|
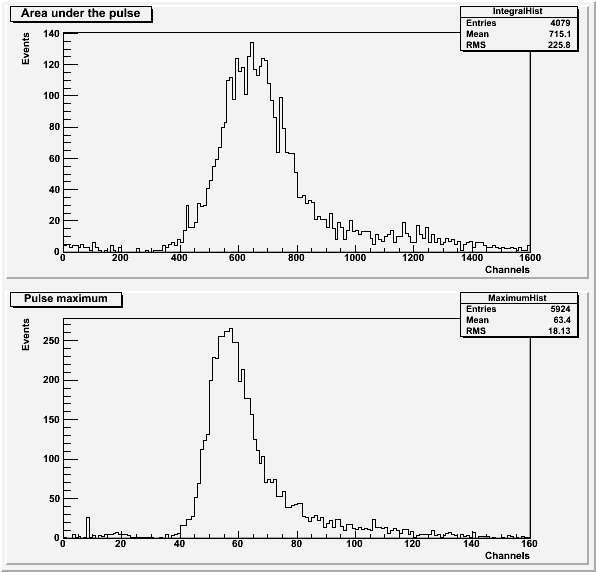 |
Both histograms in Figure 1 exclude pulses with a baseline standard deviation greater than 7. The histogram for the area under the pulse also excludes data with secondary pulses present.
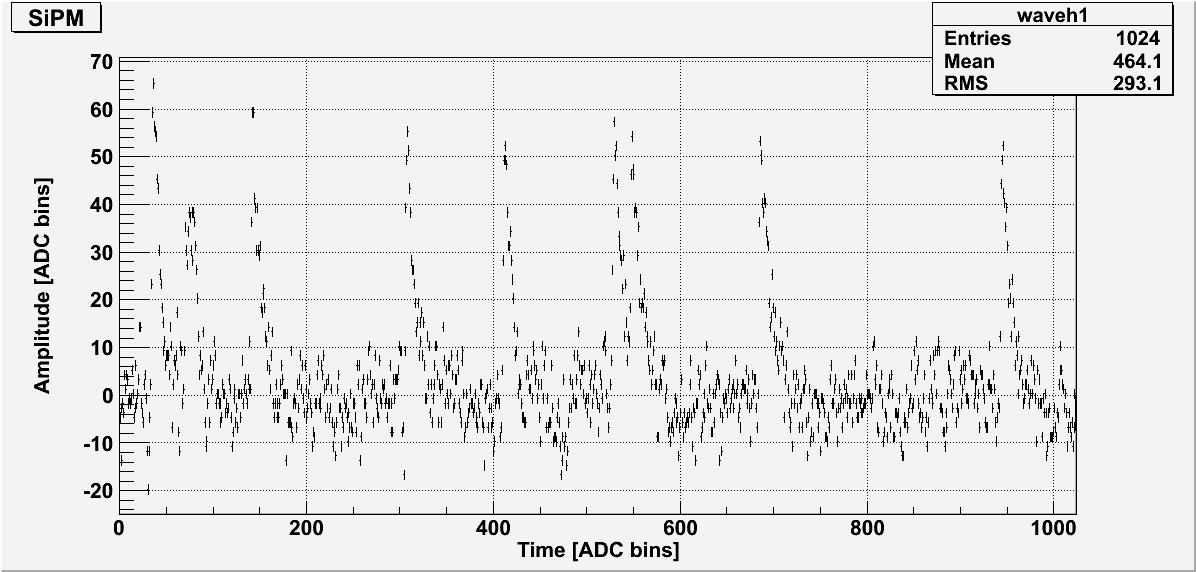
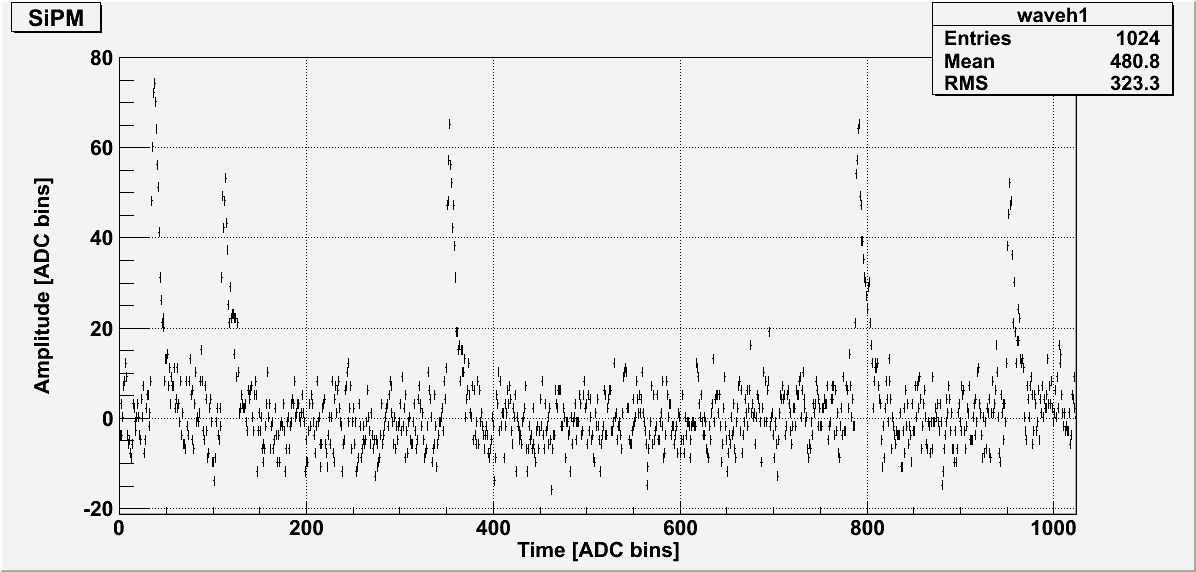
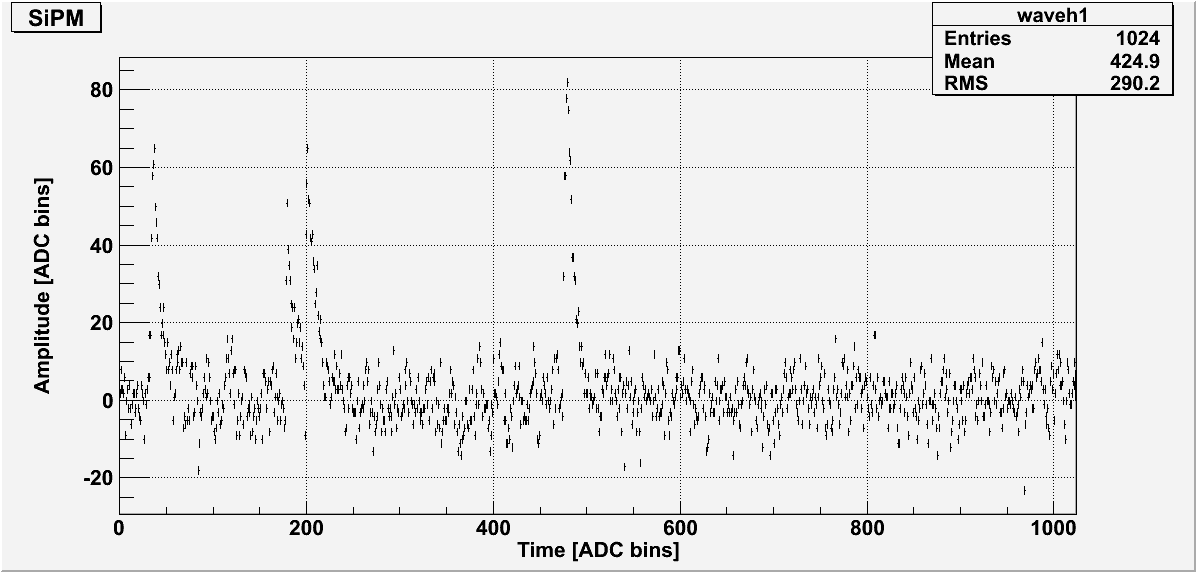
SiPM 4 was run again the the dark-box with no light source with the same set up as above, except that the DAQ was set to record 1024 samples per trigger (as opposed to default 100). The data file for this run is 130712_sipm4_darkcount.dat.
| Figure 2: Four examples of random events with multiple darkcount/lightleak pulses present. |
|---|
 |
 |
 |
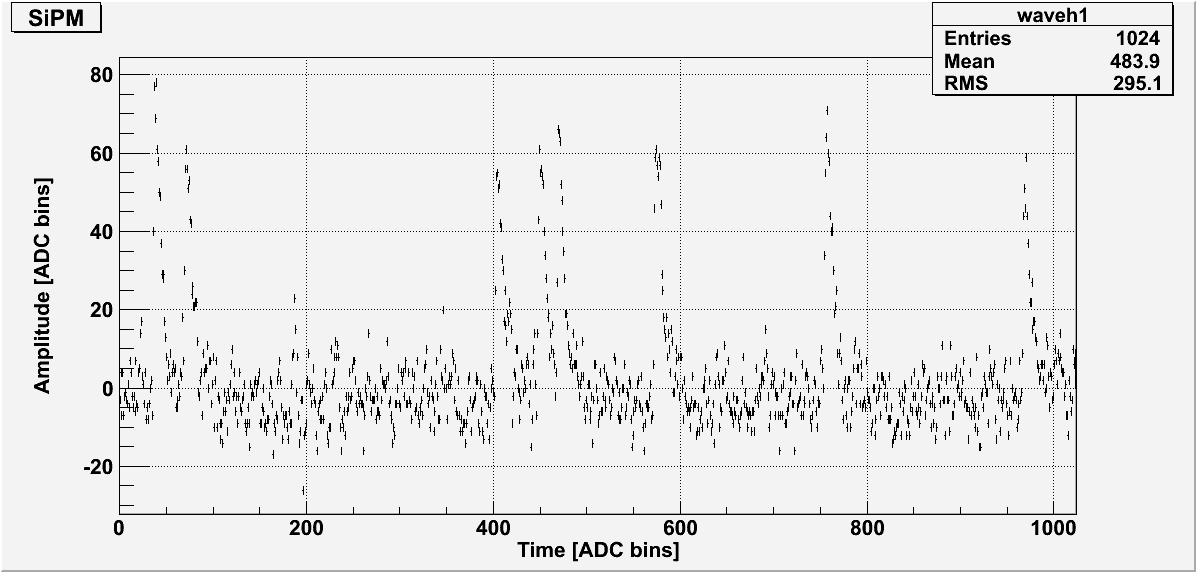 |
The conversion between ADC bins for time and seconds is 4.708 ms per channel.
| Figure 3: Dark count rates for each event. |
|---|
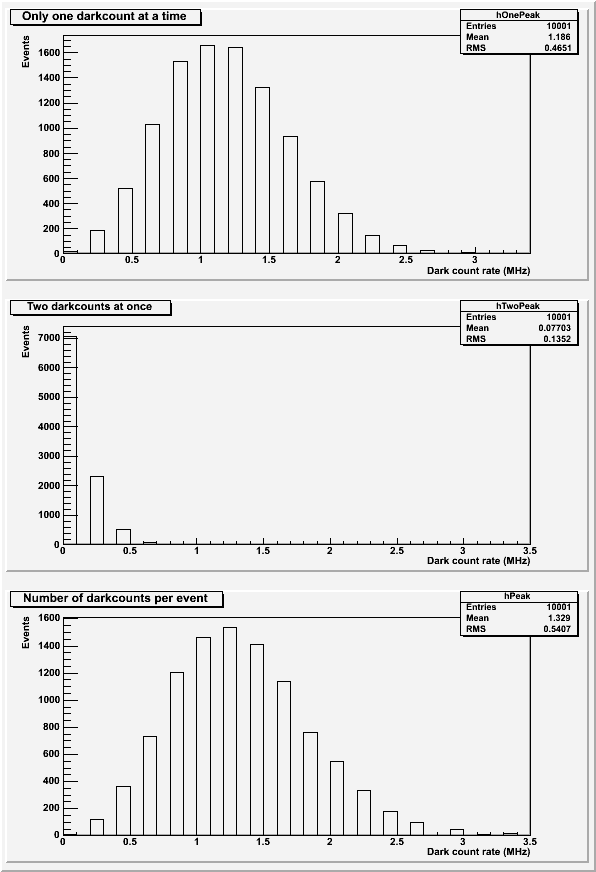 |
Figure 3a contains a histogram of the rate for only one dark count at a time. Figure 3b contains a histogram of the rate for two dark counts at the same time. Figure 3c contains a histogram of the total dark count rate per event.
The average total dark count for SiPM 4 is 1.329 MHz. Based on the average rate of two dark counts at once versus the total rate gives the probability of two dark counts occurring at once is 5.80%.