−Table of Contents
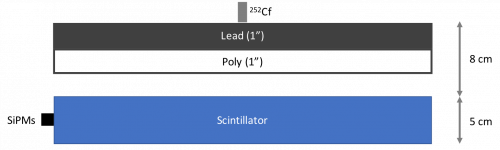
Cf-252 Runs, 1" lead shield
Data was collected from 2017/11/06 to 2017/11/10.
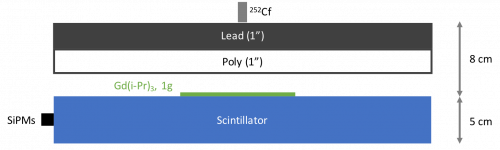
Experimental Setup
| Table 1: Run Names and Geometries | |
|---|---|
| No Source | Source |
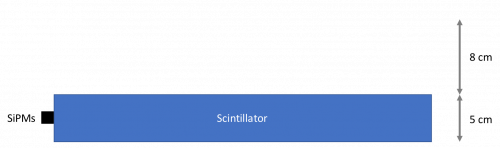 | 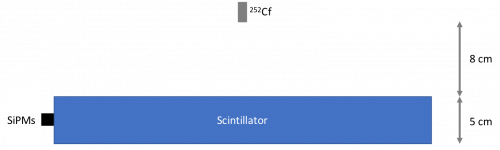 |
| Source, Pb | Source, Pb, Gd |
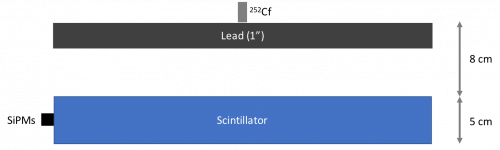 | 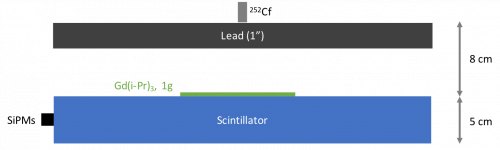 |
| Source, Pb, Poly | Source, Pb, Poly, Gd |
 |  |
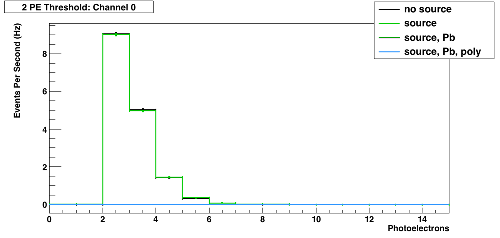
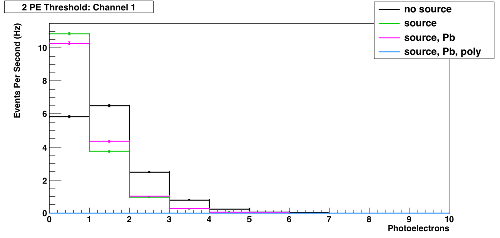
1st set of graphs:
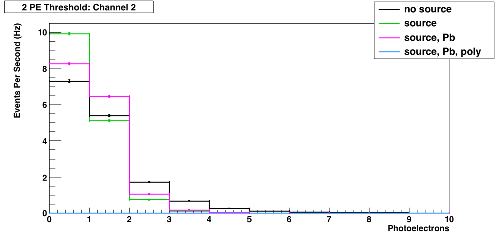
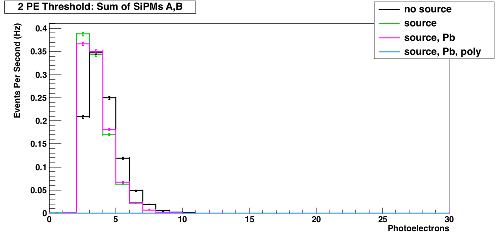
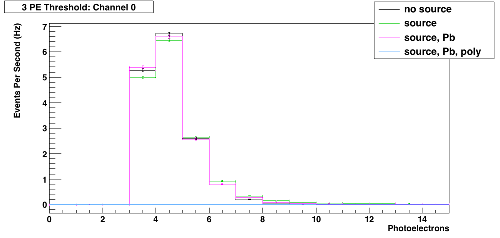
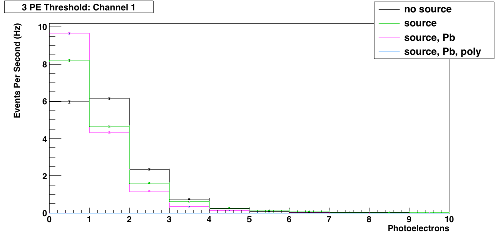
- Compare “Source” and “Source, Pb” to see effects of gamma shield
- Compare “Source, Pb” and “Source, Pb, Poly” to see possible increase in captures on hydrogen (effects of poly shield)
2nd set of graphs:
- Compare “Source, Pb, Gd” and “Source, Pb, Poly, Gd” to see possible captures on hydrogen
- Compare “Source, Pb” and “Source, Pb, Gd” to see possible captures on Gd
- Compare “Source, Pb, Poly” and “Source, Pb, Poly, Gd” to see possible captures on Gd
Results
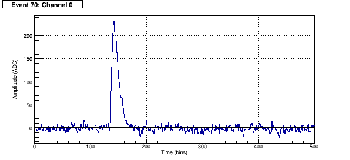
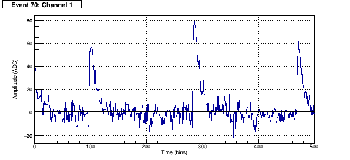
| Example Waveforms | ||
|---|---|---|
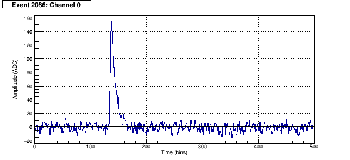
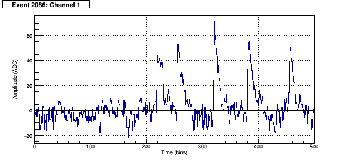
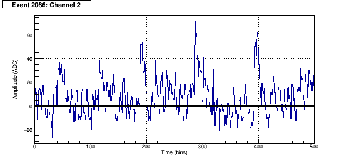
| SiPM A (best) | SiPM B (second best) | SiPM C (worst) |
 |  |  |
 |  |  |
 |  |  |
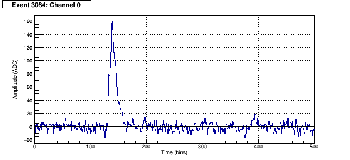 | 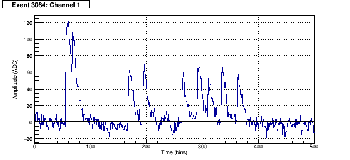 | 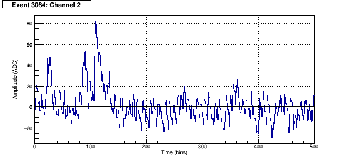 |
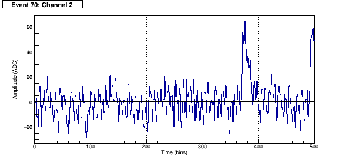
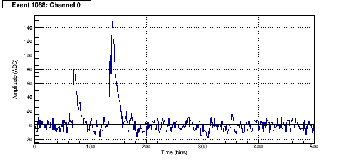
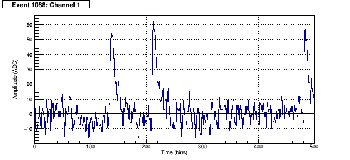
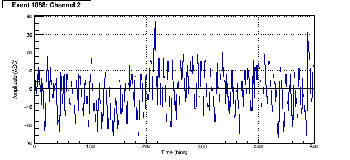
These pulse were taken from the “Source, Pb, Gd” run with a 3PE trigger. This run was done after the TB4 board had been on for a while. The behavior of SiPM C is representative of all runs. The behavior of SiPM B is worse than usual. After this run, SiPM B stopped working.
Analysis
| Table 2: Run Trigger Rates (+/- 0.1 Hz), maximum trigger rate is 16 Hz | ||||||
|---|---|---|---|---|---|---|
| Threshold (PE) | No Source | Source | Source, Pb | Source, Pb, Gd | Source, Pb, Poly | Source, Pb, Poly, Gd |
| 2 | 15.9 | 15.9 | 16.0 | – | – | – |
| 3 | 15.9 | 15.9 | 16.1 | – | – | – |
| 4 | 14.4 | 15.4 | 15.0 | – | – | – |
| 5 | 11.3 | 13.8 | 12.7 | – | – | – |
Plots Without Gadolinium
X value of bin corresponds to left edge of bar (ROOT default)
| 2 PE Trigger | |
|---|---|
| SiPM A | SiPM B |
 |  |
| SiPM C | Sum of A and B |
 |  |
| 3 PE Trigger | |
|---|---|
| SiPM A | SiPM B |
 |  |
| SiPM C | Sum of A and B |
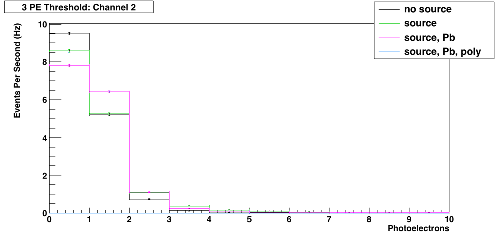 | 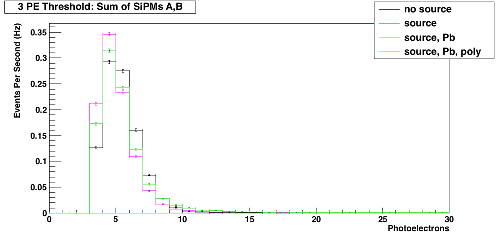 |
| 4 PE Trigger | |
|---|---|
| SiPM A | SiPM B |
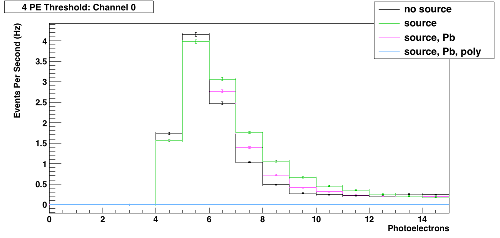 | 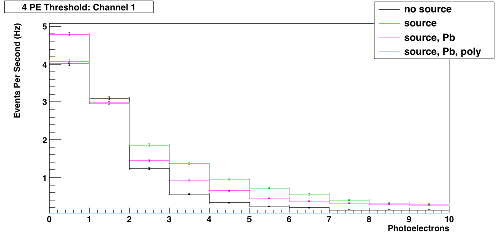 |
| SiPM C | Sum of A and B |
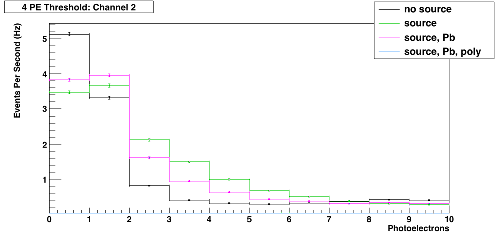 | 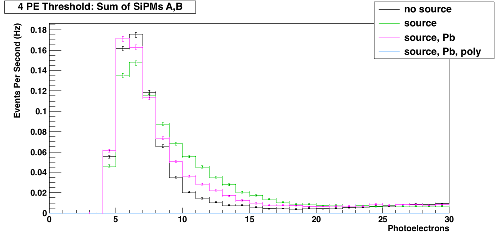 |
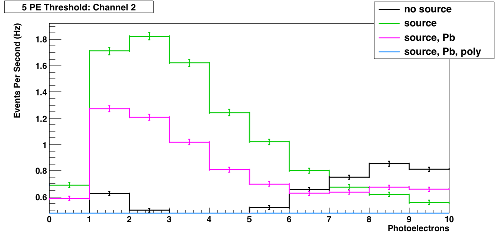
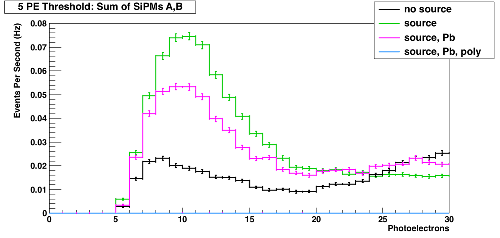
| 5 PE Trigger | |
|---|---|
| SiPM A | SiPM B |
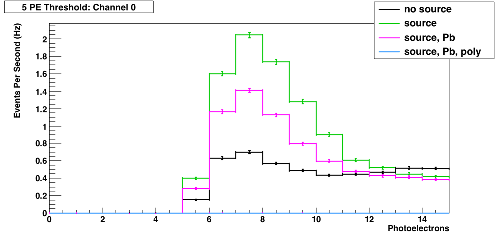 | 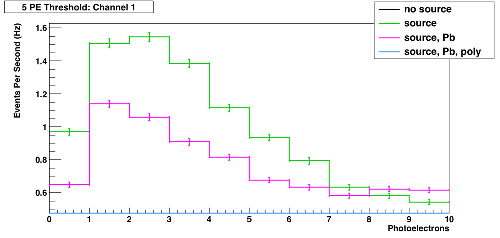 |
| SiPM C | Sum of A and B |
 |  |